
- Title
-
Dscamb regulates cone mosaic formation in zebrafish via filopodium-mediated homotypic recognition
- Authors
- Hu, D., Masai, I.
- Source
- Full text @ Nat. Commun.
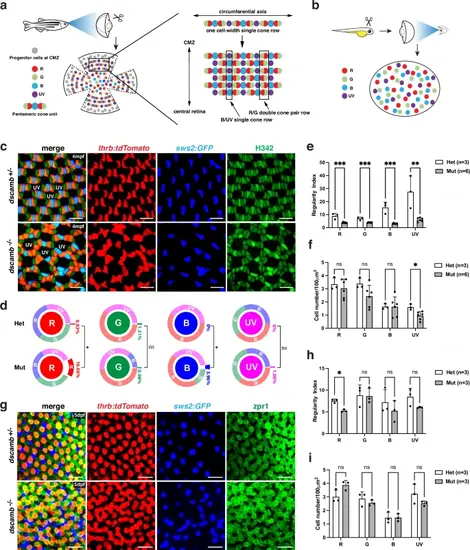
Zebrafish dscamb mutants show abnormal cone mosaic patterns.a The cone mosaic in zebrafish adult peripheral retinas. Retinal stem cells in the ciliary marginal zone (CMZ) continuously generate cones. Red, green, and blue cones form pentameric cone units. In the circumferential axis, a one-cell-width single-cone row, in which UV cones alternate with pentameric cone units, is formed. This circumferential single-cone row is repeatedly aligned to form the lattice-like cone mosaic, in which red/green double-cone pair rows and UV/blue single-cone rows appear alternately along the periphero-central axis. b Zebrafish embryonic cone mosaic. The embryonic cone mosaic is less regular; however, each cone type shows relatively equal spacing. c The cone mosaic pattern of 4 mpf Tg[thrb:tdTomato; sws2:GFP] transgenic peripheral retinas, which visualize red cones (red) and blue cones (blue), respectively. All cone nuclei were counter-stained with Heochst33342 (green). The nuclei of UV cones are not visible in this confocal plane. Three independent experiments. d The percentage of homotypic and heterotypic contacts for each cone type in adult peripheral retinas. Comparisons between dscamb mutants (n = 6) and heterozygous siblings (n = 3) were performed using unpaired two-tailed t-tests. *p < 0.05. e, f Regularity index e and cell density f for each cone type in adult peripheral retinas of heterozygous siblings (n = 3) and dscamb mutants (n = 6). g ONL in 5 dpf Tg[thrb:tdTomato; sws2:GFP] transgenic retinas labeled with zpr1 antibody that visualizes double-cone-type photoreceptors (red/green cones). Three independent experiments. h Regularity index of each cone type in embryonic retinas of heterozygous siblings (n = 3) and dscamb mutants (n = 3). i Density of each cone type in embryonic retinas of heterozygous siblings (n = 3) and dscamb mutants (n = 3). Scale bars: 10 μm c, g. e, f, h, i Mean ± SD. Statistical significance was evaluated with an unpaired t-test (two tailed): *p < 0.05, **p < 0.01, ***p < 0.001, ns: not significant. d–f, h, i Source data and p-values are provided as Source Data for Fig. 1. |
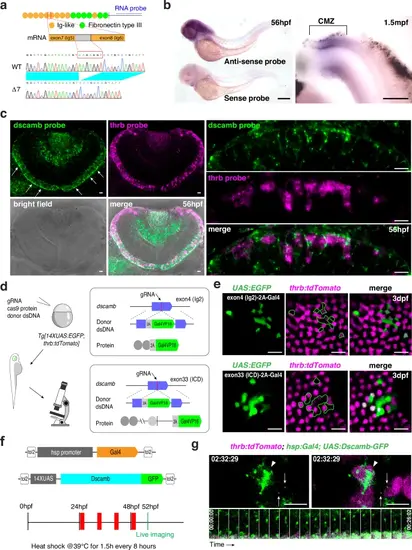
Dscamb is localized in apical filopodium-like neurites of cone photoreceptors.a Zebrafish Dscamb protein has conserved Ig-like and FNIII domains in the extracellular domain. In addition to one full-length isoform, we detected cDNA encoding a 7-bp-deletion isoform. An RNA probe is designed in the intracellular domain. b In situ hybridization of 56-hpf zebrafish embryos (left) and 1.5-mpf dissected retinas (right) with a dscamb RNA probe. dscamb mRNA is expressed in differentiating photoreceptors near the retinal ciliary marginal zone (CMZ). Three independent experiments. c In situ hybridization of 56-hpf retinas with dscamb (green) and thrb (magenta) RNA probes. dscamb mRNA is expressed in photoreceptor layer (white arrows in left upper panel). Higher magnification images (right panels) indicate that dscamb mRNA signals were detected in both thrb-positive (red cones) and -negative photoreceptors. Three independent experiments. d CRISPR/Cas9-mediated strategy of in-frame knock-in of 2A-Gal4VP16 DNA into exon 4 and exon 33 of the dscamb gene. e Mosaic generation of photoreceptors in which 2A-Gal4VP16 DNA was inserted in-frame in exon 4 (upper panels) and exon 33 (bottom panels) of the dscamb gene in 3-dpf Tg[UAS:EGFP; thrb:tdTomato] transgenic retinas. tdTomato labels red cones. EGFP (green) was expressed in both red cones and non-red cone photoreceptors in both cases. Three independent experiments for each exon trapping. f Experimental design to visualize GFP-tagged Dscamb in cones. Transgenic embryos carrying Tg[hsp:Gal4; UAS:Dscamb-GFP] were used for live scanning at 52 hpf after multiple heat-shock treatments. g Live imaging of apical surfaces of red cones in transgenic embryos carrying Tg[hsp:Gal4; UAS:Dscamb-GFP; thrb:tdTomato] at 52 hpf. tdTomato labels red cones. GFP-tagged Dscamb was accumulated on apical domains (arrowheads) and at tips of filopodia (arrows). The time series montage (bottom panels) indicates that GFP-tagged Dscamb localization at the filopodial tip is maintained during filopodial extending/retracting cycle. Scale bars: 300 μm b, 10 μm c, e and 5 μm g |
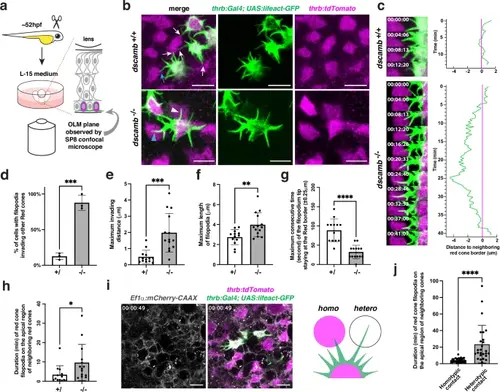
Dscamb is required for filopodium-mediated homotypic recognition.a Experimental design for ex vivo live imaging. OLM: outer limiting membrane. b Confocal images of the apical surface of a cone photoreceptor layer with two transgenes Tg[thrb:Gal4VP16; UAS:lifeact-GFP] and Tg[thrb:tdTomato], which visualize apical filopodia (green) and cell bodies (magenta) of red cones, respectively. In wild type, red cones extend multiple filopodia toward neighboring cones. However, filopodia stop growing when they meet neighboring red cones (white/blue arrows). On the other hand, in dscamb mutants, filopodia keep growing even after they contact other red cones (white/blue arrowheads). A blue arrow and arrowhead indicate wild-type and dscamb mutant filopodia used for time-lapse analysis shown in the panel c. Three independent experiments. c Time-lapse observation of filopodial behavior in wild-type and dscamb mutant red cones. Right histograms show a temporal profile of the distance between a filopodial tip and an apical domain border of neighboring red cones, which was measured every 20.6 s. d Percentage of red cones with invading filopodia. e Maximum invading distance of apical filopodia. f Maximum length of apical filopodia. g Maximum consecutive time of filopodium tip staying within the border zone ( ± 0.25 μm) of the apical domain of red cones. h Residence time of red cone filopodia on apical domains of neighboring red cones. i Confocal scanning of the photoreceptor layer in triple transgenic Tg[thrb:Gal4VP16; UAS:lifeact-GFP; Ef1α:mCherry-CAAX] retinas, which visualize red cone filopodia (green) contacting on other red cones (homotypic, magenta) or other non-red cone-type photoreceptors (heterotypic, white). j Residence time of red cone filopodia (collected from 3 wild-type samples) on apical domains of other red cones (homotypic contact) or other non-red cone-type photoreceptors (heterotypic contact). d–h, j Means ± SD. Statistical significance was evaluated with unpaired t-tests (two tail): *p < 0.0332, **p < 0.0021, ***p < 0.0002, and ****p < 0.0001. Biological replicates: d Three embryos. e–h n = 13 for wild-type filopodia and n = 14 for dscamb mutant filopodia. j n = 30 for filopodia showing homotypic contact and n = 26 for filopodia showing heterotypic contact. Scale bars: 5 μm b, i. d–h, j Source data and p-values are provided as Source Data for Fig. 3. |
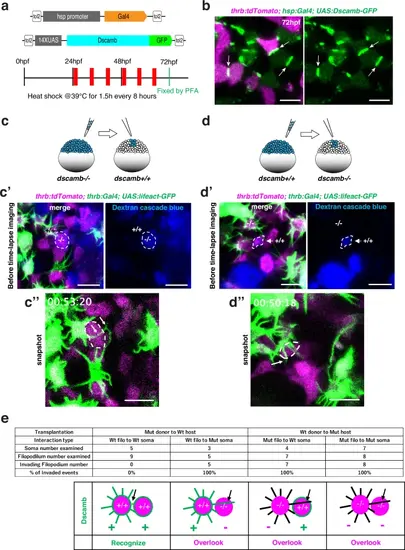
Filopodium-mediated homotypic recognition requires homophilic interaction of Dscamb.a Experimental design to visualize Dscamb-GFP protein in cones at 72 hpf. b Confocal imaging of the ONL of Tg[thrb:tdTomato; hsp:Gal4; UAS:Dscamb-GFP] transgenic retinas. Dscamb-GFP was localized to the interface between GFP-positive cells (arrows). Three independent experiments. c, d Cell transplantation experiments with dscamb mutant donor cells in wild-type host retinas c and vice vasa d. Both donor and host embryos carry Tg[thrb:tdTomato] to visualize all the red cones (magenta). At least, either donor or host embryos carries Tg[thrb:Gal4VP16; UAS: lifeact-GFP] to visualize filopodia of red cones (green). Donor cells were injected with Dextran cascade blue (blue) at the 1-cell stage and transplanted into host embryos at the blastula stage to generate chimeric retinas at 52 hpf. c’, d’ Before time-lapse scanning, we selected a single donor red cone (dotted outline), which had both thrb:tdTomato and Dextran cascade blue and was also close to host red cones expressing both thrb:tdTomato and Lifeact-GFP. Biological replicates are indicated by sample size shown in e. c”, d” Extension behaviors of Lifeact-GFP-labeled host filopodia to a donor red cone after around 1 h time-lapse scanning. In both transplantation from mutant donor to wild-type host c” and from wild-type donor to mutant host d”, filopodia of the host red cone (arrow) invade the apical domain of the donor red cone (dotted outline). e Summary of transplantation results. The upper table indicates the sample size and the percentage of filopodial invaded events for each donor-host combination. The lower schematic drawing indicates that filopodia (black arrows) of red cones (magenta) stop their extension to neighboring red cones, only when both filopodia-extending red cones and targeting red cones express Dscamb (green). Scale bars: 5 μm b, c’-c”, d’-d”. |
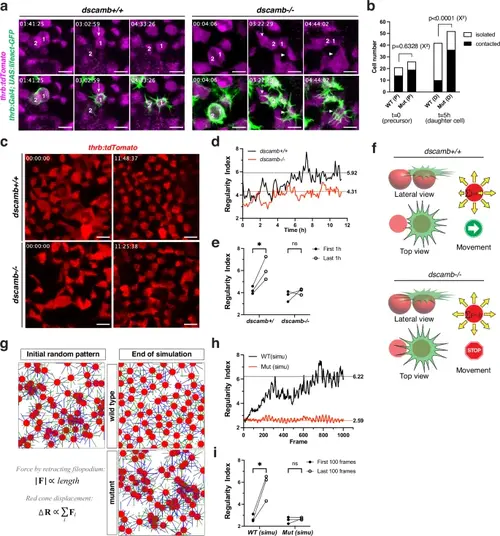
Filopodium-mediated avoidance movement promotes mosaic spacing of red cones.a Time-lapse imaging of twin red cones in Tg[thrb:Gal4VP16; UAS:lifeact-GFP; thrb:tdTomato] transgenic retinas. The top row indicates the magenta channel (thrb:tdTomato). Lifeact-GFP-expressing twin red cones arise by progenitor division (each left panel). Their filopodia avoid neighboring red cones in wild-type, but grow into neighboring red cones in dscamb mutants (each middle panel, arrow). Twin red cones progressively separate from each other and from other red cones in wild-type, but remain associated with each other and with other red cones in mutants (each right panel). A red cone used filopodia to associate with other red cones (middle and right panels of mutant, arrowhead). b Numbers of red cone progenitor cells (P) and their red cone progeny (D), which are contacted by (black bars) or isolated from other red cones (white bars). Statistical difference was evaluated with the chi-square test (two tail). c Twelve-hour time-lapse scanning of red cone spacing in Tg[thrb:tdTomato] transgenic retinas after 52 hpf. d Temporal profile of the regularity index of red cones, shown in panel c. Dashed lines represent the mean of the regularity index of the last 1 h. e Comparison of mean regularity indices of the first and last one hour. Three biological replicates. Statistical significance was evaluated with paired t-test (two tailed): *p < 0.05, ns: not significant. f A model for mechanical regulation of cone movement, in which each cone may receive pulling force through its apical filopodia anchored to neighboring cones. g Computer simulation of red cone spacing based on the mechanical model shown in f. h Temporal profile of the regularity index of red cones, shown in g. Dashed lines represent the mean of the regularity index of the last 100 frames. i Comparison of mean regularity indices between the first and last 100 frames. Three technical replicates for computer simulation including an initial random setting for cone mosaic pattern, filopodial length and movement. Paired t-tests (two tailed): *p < 0.05, ns: not significant. Scale bars: 5 μm a, c. Source data and p-values b, e, i are provided as Source Data for Fig. 5. |
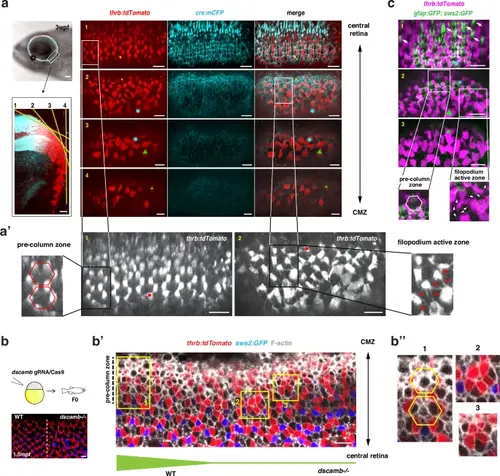
Dscamb regulates cone mosaic pattern in the pre-column zone of adult retinas.a Retinal ciliary marginal zone (CMZ) of Tg[thrb:tdTomato; crx:mCFP] transgenic fish at 3 wpf. Using the ventro-temporal retinal CMZ (square in the upper left panel), four overlapping tangential sections covering the apical surface from central (section 1) to peripheral (section 4) direction are scanned. Red cones and plasma membranes are shown in tdTomato (red) and mCFP (cyan) fluorescence, respectively. Small geometric landmarks adjust the overlapping position. a’ Higher magnification of tdTomato fluorescent images of sections 1 and 2, shown in a. In section 1, differentiating red cones form a hexagonal pattern, indicating the pre-column zone. In section 2, the filopodium active zone, where red cones extend multiple filopodia (red arrowheads), forms just peripheral to the pre-column zone. b Generation of the dscamb mutant area in the retinal CMZs of Tg[thrb:tdTomato; sws2:GFP] transgenic wild-type fish at 1.5 mpf (upper panels). In the peripheral retina, a regular lattice cone mosaic is formed on the left side, whereas the dscamb mutant area showing red cone clustering is induced on the right side (bottom panel). b’ Higher magnification of the CMZ of wild-type and dscamb mutant chimeric retinas. Phalloidin labeling visualizes F-actin (white). Square 1 and squares 2/3 are selected from the pre-column zone of wild-type and dscamb mutant areas, respectively. Thickness of the bottom green line indicates presumptive Dscamb activity. b” Higher magnification of square 1-3 shown in b’. Square 1 indicates a hexagonal pattern of red cones. Squares 2/3 indicate red cone clustering. c Retinal CMZ in Tg[thrb:tdTomato; gfap:GFP; sws2:GFP] transgenic fish at 18 dpf. Three overlapping tangential sections (section 1-3) cover retinal CMZs. Small geometric landmarks adjust the overlapping position. Differentiating blue cones (white arrows) appear in Section 1. Section 2 contains the pre-column zone and the filopodium-active zone. In the latter, red cones extend multiple filopodia (white arrowheads). gfap:GFP starts to be expressed at the interface between the filopodium-active zone and the pre-column zone. a–c Three independent experiments. Scale bars are 10 μm a–c, except 100 μm for the upper left image in (a). |