
|
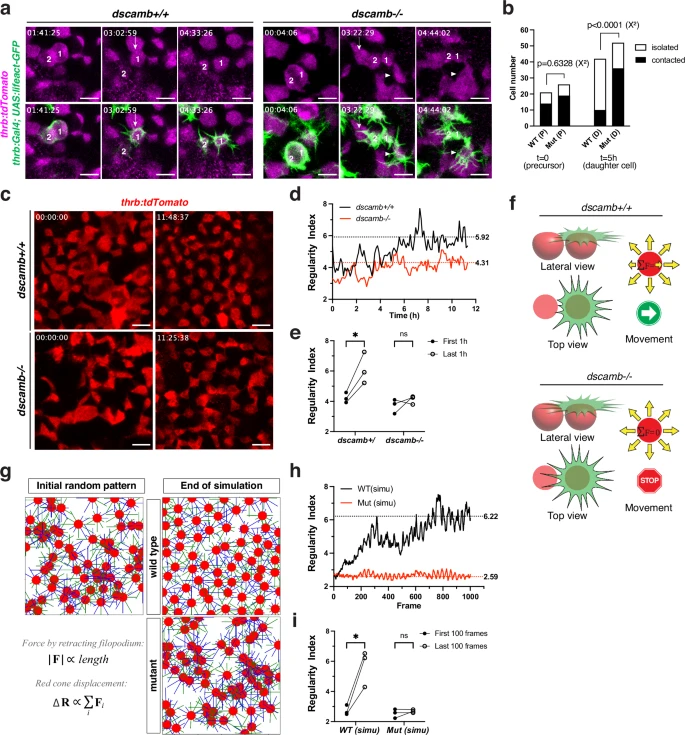
Fig. 5 Filopodium-mediated avoidance movement promotes mosaic spacing of red cones.a Time-lapse imaging of twin red cones in Tg[thrb:Gal4VP16; UAS:lifeact-GFP; thrb:tdTomato] transgenic retinas. The top row indicates the magenta channel (thrb:tdTomato). Lifeact-GFP-expressing twin red cones arise by progenitor division (each left panel). Their filopodia avoid neighboring red cones in wild-type, but grow into neighboring red cones in dscamb mutants (each middle panel, arrow). Twin red cones progressively separate from each other and from other red cones in wild-type, but remain associated with each other and with other red cones in mutants (each right panel). A red cone used filopodia to associate with other red cones (middle and right panels of mutant, arrowhead). b Numbers of red cone progenitor cells (P) and their red cone progeny (D), which are contacted by (black bars) or isolated from other red cones (white bars). Statistical difference was evaluated with the chi-square test (two tail). c Twelve-hour time-lapse scanning of red cone spacing in Tg[thrb:tdTomato] transgenic retinas after 52 hpf. d Temporal profile of the regularity index of red cones, shown in panel c. Dashed lines represent the mean of the regularity index of the last 1 h. e Comparison of mean regularity indices of the first and last one hour. Three biological replicates. Statistical significance was evaluated with paired t-test (two tailed): *p < 0.05, ns: not significant. f A model for mechanical regulation of cone movement, in which each cone may receive pulling force through its apical filopodia anchored to neighboring cones. g Computer simulation of red cone spacing based on the mechanical model shown in f. h Temporal profile of the regularity index of red cones, shown in g. Dashed lines represent the mean of the regularity index of the last 100 frames. i Comparison of mean regularity indices between the first and last 100 frames. Three technical replicates for computer simulation including an initial random setting for cone mosaic pattern, filopodial length and movement. Paired t-tests (two tailed): *p < 0.05, ns: not significant. Scale bars: 5 μm a, c. Source data and p-values b, e, i are provided as Source Data for Fig. 5.