
Fig. 6
- ID
- ZDB-FIG-250428-132
- Publication
- Hu et al., 2025 - Dscamb regulates cone mosaic formation in zebrafish via filopodium-mediated homotypic recognition
- Other Figures
- All Figure Page
- Back to All Figure Page
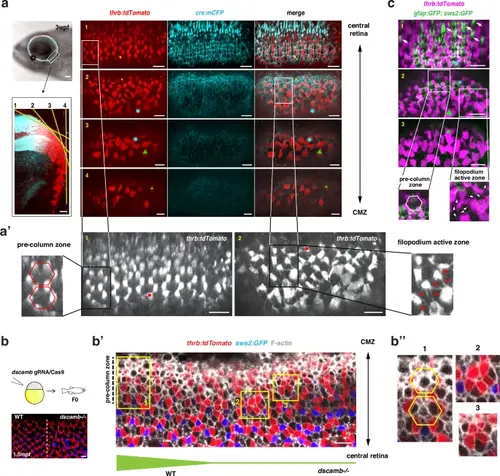
Dscamb regulates cone mosaic pattern in the pre-column zone of adult retinas.a Retinal ciliary marginal zone (CMZ) of Tg[thrb:tdTomato; crx:mCFP] transgenic fish at 3 wpf. Using the ventro-temporal retinal CMZ (square in the upper left panel), four overlapping tangential sections covering the apical surface from central (section 1) to peripheral (section 4) direction are scanned. Red cones and plasma membranes are shown in tdTomato (red) and mCFP (cyan) fluorescence, respectively. Small geometric landmarks adjust the overlapping position. a’ Higher magnification of tdTomato fluorescent images of sections 1 and 2, shown in a. In section 1, differentiating red cones form a hexagonal pattern, indicating the pre-column zone. In section 2, the filopodium active zone, where red cones extend multiple filopodia (red arrowheads), forms just peripheral to the pre-column zone. b Generation of the dscamb mutant area in the retinal CMZs of Tg[thrb:tdTomato; sws2:GFP] transgenic wild-type fish at 1.5 mpf (upper panels). In the peripheral retina, a regular lattice cone mosaic is formed on the left side, whereas the dscamb mutant area showing red cone clustering is induced on the right side (bottom panel). b’ Higher magnification of the CMZ of wild-type and dscamb mutant chimeric retinas. Phalloidin labeling visualizes F-actin (white). Square 1 and squares 2/3 are selected from the pre-column zone of wild-type and dscamb mutant areas, respectively. Thickness of the bottom green line indicates presumptive Dscamb activity. b” Higher magnification of square 1-3 shown in b’. Square 1 indicates a hexagonal pattern of red cones. Squares 2/3 indicate red cone clustering. c Retinal CMZ in Tg[thrb:tdTomato; gfap:GFP; sws2:GFP] transgenic fish at 18 dpf. Three overlapping tangential sections (section 1-3) cover retinal CMZs. Small geometric landmarks adjust the overlapping position. Differentiating blue cones (white arrows) appear in Section 1. Section 2 contains the pre-column zone and the filopodium-active zone. In the latter, red cones extend multiple filopodia (white arrowheads). gfap:GFP starts to be expressed at the interface between the filopodium-active zone and the pre-column zone. a–c Three independent experiments. Scale bars are 10 μm a–c, except 100 μm for the upper left image in (a). |