
Fig. 4
- ID
- ZDB-FIG-250428-130
- Publication
- Hu et al., 2025 - Dscamb regulates cone mosaic formation in zebrafish via filopodium-mediated homotypic recognition
- Other Figures
- All Figure Page
- Back to All Figure Page
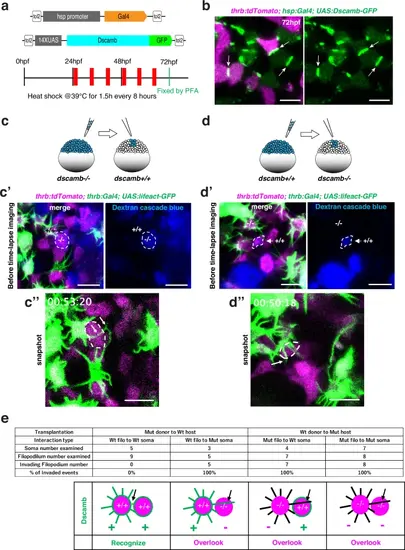
Filopodium-mediated homotypic recognition requires homophilic interaction of Dscamb.a Experimental design to visualize Dscamb-GFP protein in cones at 72 hpf. b Confocal imaging of the ONL of Tg[thrb:tdTomato; hsp:Gal4; UAS:Dscamb-GFP] transgenic retinas. Dscamb-GFP was localized to the interface between GFP-positive cells (arrows). Three independent experiments. c, d Cell transplantation experiments with dscamb mutant donor cells in wild-type host retinas c and vice vasa d. Both donor and host embryos carry Tg[thrb:tdTomato] to visualize all the red cones (magenta). At least, either donor or host embryos carries Tg[thrb:Gal4VP16; UAS: lifeact-GFP] to visualize filopodia of red cones (green). Donor cells were injected with Dextran cascade blue (blue) at the 1-cell stage and transplanted into host embryos at the blastula stage to generate chimeric retinas at 52 hpf. c’, d’ Before time-lapse scanning, we selected a single donor red cone (dotted outline), which had both thrb:tdTomato and Dextran cascade blue and was also close to host red cones expressing both thrb:tdTomato and Lifeact-GFP. Biological replicates are indicated by sample size shown in e. c”, d” Extension behaviors of Lifeact-GFP-labeled host filopodia to a donor red cone after around 1 h time-lapse scanning. In both transplantation from mutant donor to wild-type host c” and from wild-type donor to mutant host d”, filopodia of the host red cone (arrow) invade the apical domain of the donor red cone (dotted outline). e Summary of transplantation results. The upper table indicates the sample size and the percentage of filopodial invaded events for each donor-host combination. The lower schematic drawing indicates that filopodia (black arrows) of red cones (magenta) stop their extension to neighboring red cones, only when both filopodia-extending red cones and targeting red cones express Dscamb (green). Scale bars: 5 μm b, c’-c”, d’-d”. |