
Fig. 1
- ID
- ZDB-FIG-250428-127
- Publication
- Hu et al., 2025 - Dscamb regulates cone mosaic formation in zebrafish via filopodium-mediated homotypic recognition
- Other Figures
- All Figure Page
- Back to All Figure Page
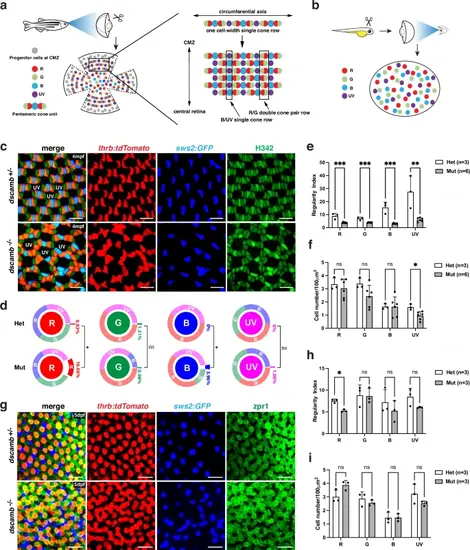
Zebrafish dscamb mutants show abnormal cone mosaic patterns.a The cone mosaic in zebrafish adult peripheral retinas. Retinal stem cells in the ciliary marginal zone (CMZ) continuously generate cones. Red, green, and blue cones form pentameric cone units. In the circumferential axis, a one-cell-width single-cone row, in which UV cones alternate with pentameric cone units, is formed. This circumferential single-cone row is repeatedly aligned to form the lattice-like cone mosaic, in which red/green double-cone pair rows and UV/blue single-cone rows appear alternately along the periphero-central axis. b Zebrafish embryonic cone mosaic. The embryonic cone mosaic is less regular; however, each cone type shows relatively equal spacing. c The cone mosaic pattern of 4 mpf Tg[thrb:tdTomato; sws2:GFP] transgenic peripheral retinas, which visualize red cones (red) and blue cones (blue), respectively. All cone nuclei were counter-stained with Heochst33342 (green). The nuclei of UV cones are not visible in this confocal plane. Three independent experiments. d The percentage of homotypic and heterotypic contacts for each cone type in adult peripheral retinas. Comparisons between dscamb mutants (n = 6) and heterozygous siblings (n = 3) were performed using unpaired two-tailed t-tests. *p < 0.05. e, f Regularity index e and cell density f for each cone type in adult peripheral retinas of heterozygous siblings (n = 3) and dscamb mutants (n = 6). g ONL in 5 dpf Tg[thrb:tdTomato; sws2:GFP] transgenic retinas labeled with zpr1 antibody that visualizes double-cone-type photoreceptors (red/green cones). Three independent experiments. h Regularity index of each cone type in embryonic retinas of heterozygous siblings (n = 3) and dscamb mutants (n = 3). i Density of each cone type in embryonic retinas of heterozygous siblings (n = 3) and dscamb mutants (n = 3). Scale bars: 10 μm c, g. e, f, h, i Mean ± SD. Statistical significance was evaluated with an unpaired t-test (two tailed): *p < 0.05, **p < 0.01, ***p < 0.001, ns: not significant. d–f, h, i Source data and p-values are provided as Source Data for Fig. 1. |