
- Title
-
The transcription factor Jun is necessary for optic nerve regeneration in larval zebrafish
- Authors
- Sarich, S.C., Sreevidya, V.S., Udvadia, A.J., Svoboda, K.R., Gutzman, J.H.
- Source
- Full text @ PLoS One
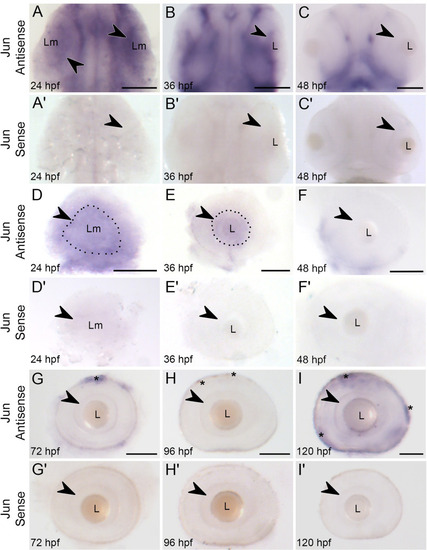
Whole mount |
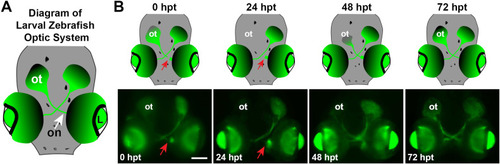
Larval zebrafish optic system, optic nerve transection, and axon regeneration timeline. |
( |
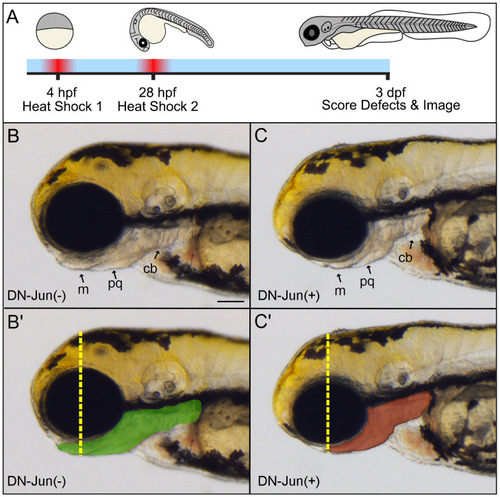
Early induction of DN-Jun results in developmental defects associated with |
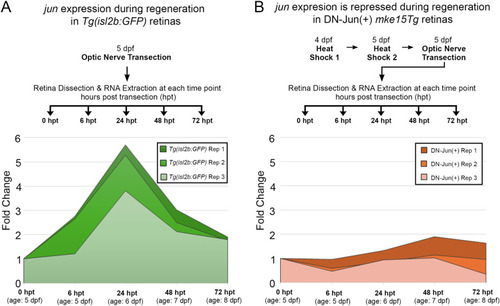
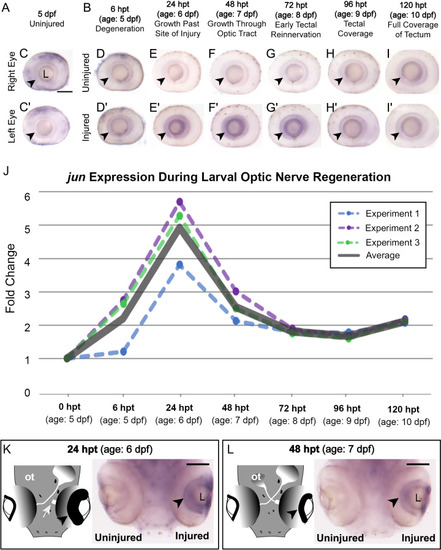
Induction of DN-Jun inhibits endogenous |
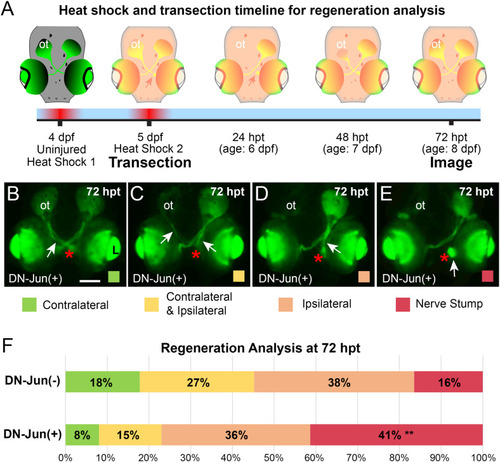
Induction of DN-Jun diminishes capacity for optic nerve regeneration. |
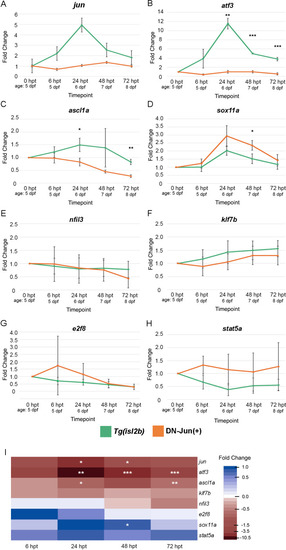
Putative Jun targets display varied expression patterns during larval optic nerve regeneration in control and Jun knockdown conditions. ( |