IMAGE

Fig 7

ID
ZDB-IMAGE-250313-8
Source
Figures for Sarich et al., 2025
Image
Figure Caption

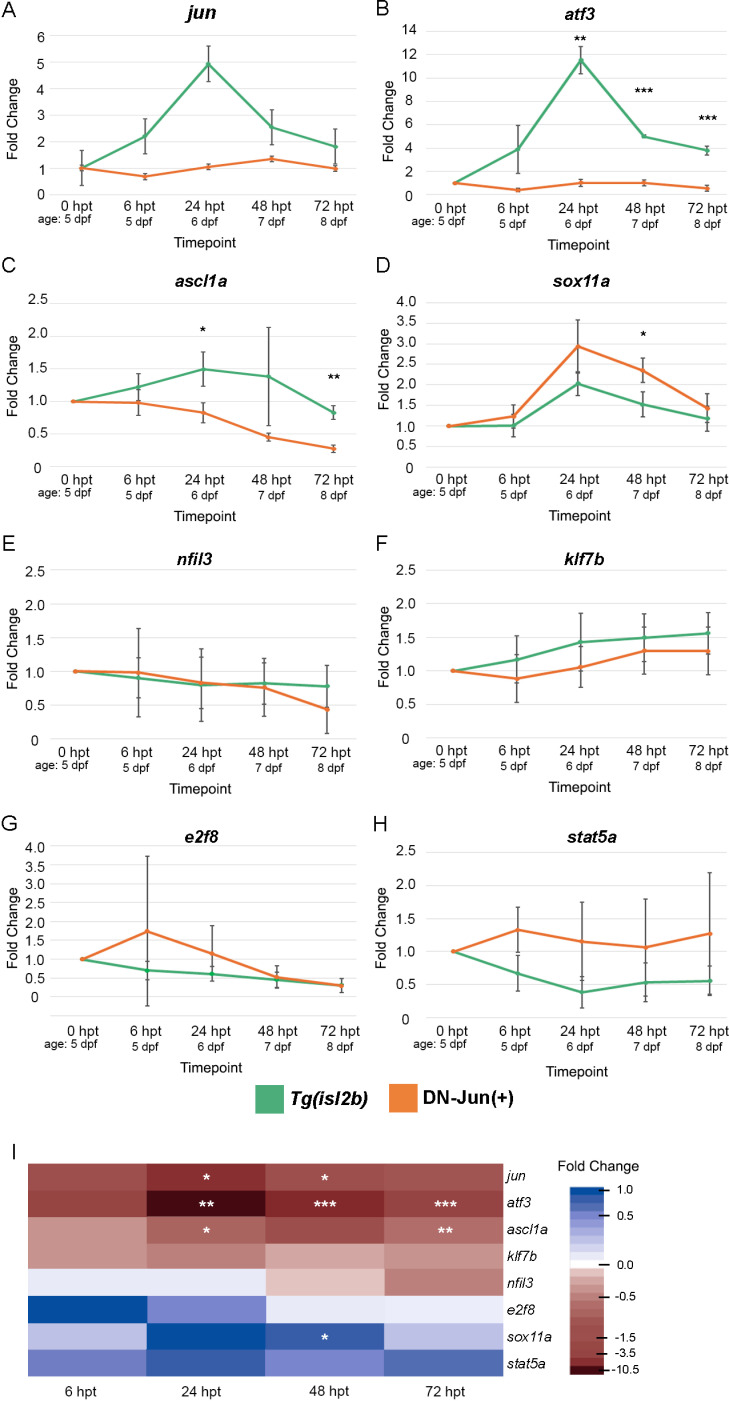
Fig 7 Putative Jun targets display varied expression patterns during larval optic nerve regeneration in control and Jun knockdown conditions.

(A–H) RT-qPCR of jun and putative Jun target genes showing average expression during regeneration in Tg(isl2b:GFP) progeny (green lines) and Tg(isl2b:GFP) X Tg(mke15Tg) DN-Jun(+), Jun knockdown, progeny (orange lines). I: Heatmap showing difference in average fold change of jun and its putative targets’ expression between Tg(isl2b:GFP) and DN-Jun(+) conditions. A–H. Average fold change of three individual replicates were plotted for each condition and timepoint. Each timepoint required n =  90 retinas (30 retinas per replicate for 3 replicates) for both Tg(isl2b:GFP) and DN-Jun(+) experiments. Student’s T-Test was used to determine statistical significance between control and knockdown conditions for each timepoint. *  =  p < 0.05, ** =  p < 0.01, *** =  p < 0.001, **** =  p < 0.0001. All transcripts and primers for these data are shown in Table 1 and transcript ID can be found in S2 Table.

Acknowledgments
This image is the copyrighted work of the attributed author or publisher, and ZFIN has permission only to display this image to its users. Additional permissions should be obtained from the applicable author or publisher of the image. Full text @ PLoS One