
- Title
-
Reduced EIF6 dosage attenuates TP53 activation in models of Shwachman-Diamond syndrome
- Authors
- Oyarbide, U., Bezzerri, V., Staton, M., Boni, C., Shah, A., Cipolli, M., Calo, E., Corey, S.J.
- Source
- Full text @ Journal of Clin. Invest.
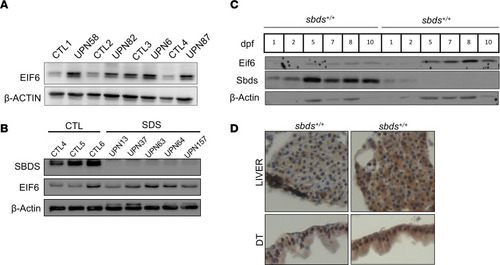
Eif6 accumulation in patients with SDS and Western blots showing EIF6 accumulation in SDS lymphoblasts ( |
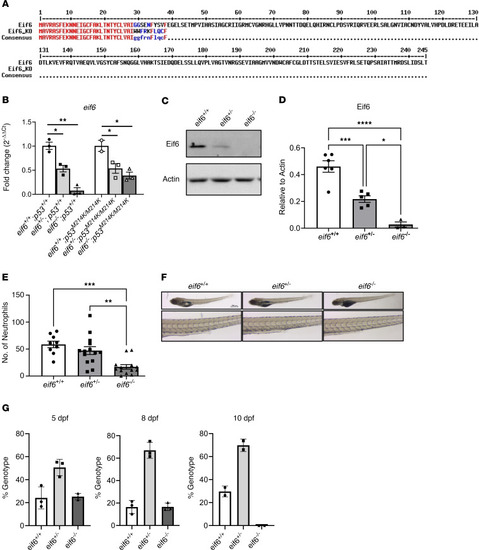
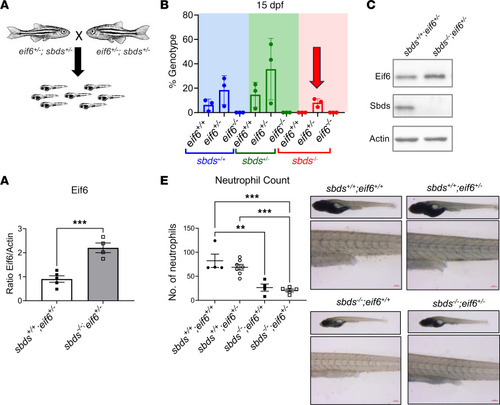
Eif6 is essential for zebrafish embryonic development. ( |
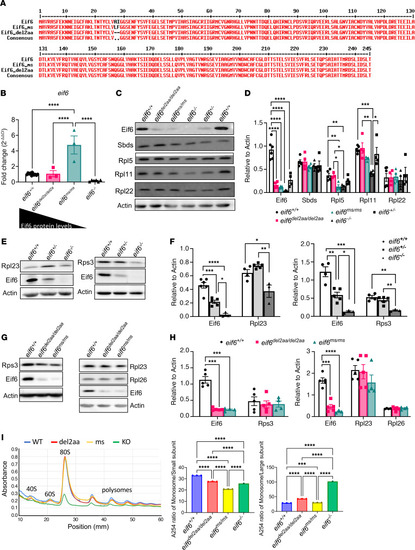
Low levels of Eif6 are enough for survival to adulthood, but only an absence of ( |
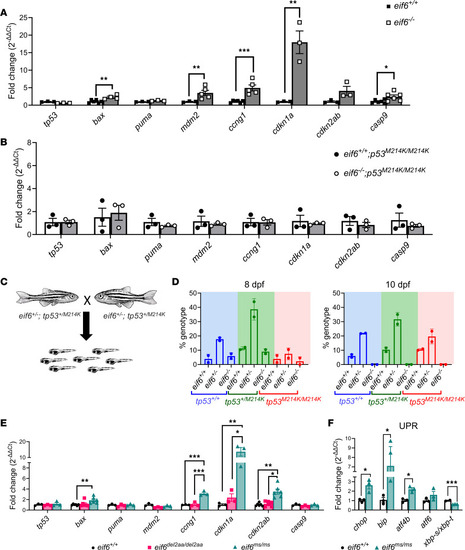
Tp53 pathway activation in RT-qPCR analysis of |
Partial rescue of ( |

Correlation of Eif6 levels with tp53 activation in ( |
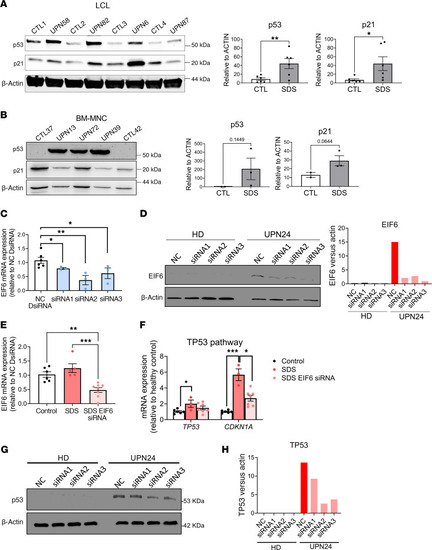
Tp53 activation in SDS patient–derived cells. Western blots and quantification of ( |