IMAGE

Figure 6

ID
ZDB-IMAGE-250417-117
Source
Figures for Oyarbide et al., 2025
Image
Figure Caption

Figure 6 
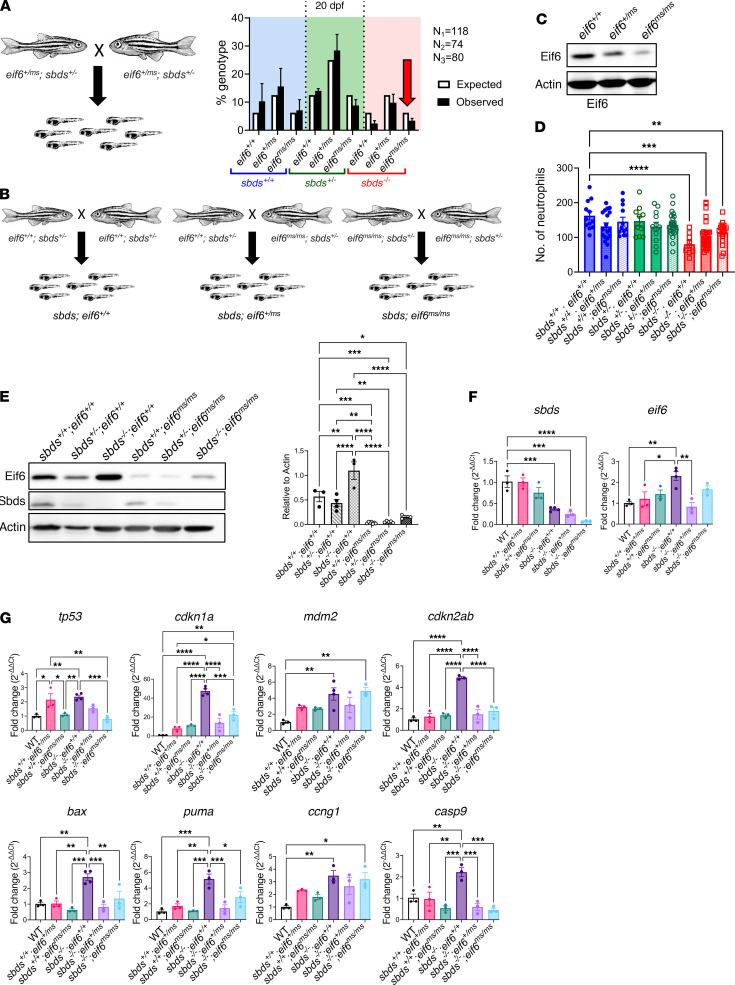
Correlation of Eif6 levels with tp53 activation in sbds-KO zebrafish.

(A) Scheme of sbds+/– crossings in the WT and Eif6 missense mutants and percentage of genotypes observed at 20 dpf. (B) Schemes of the 3 different crosses to obtain sbds WT and KO zebrafish on the eif6+/+, eif6+/ms, and eif6ms/ms backgrounds. (C) Immunoblot showing Eif6 accumulation in sbds-KO zebrafish. (D) Neutrophil counts at 10 dpf. *P < 0.05, **P < 0.01, ***P < 0.001, by 1-way ANOVA with Dunnett’s test. (E) Protein levels in sbds+/+, sbds+/–, and sbds–/–, in the eif6+/+ and eif6ms/ms mutant backgrounds, along with protein quantification. (F) RT-qPCR results for sbds and eif6 (G) and the tp53 pathway. *P < 0.05, **P < 0.01, ***P < 0.001, and ****P < 0.0001, by 1-way ANOVA with Tukey’s test. Data represent the mean ± SEM.

Acknowledgments
This image is the copyrighted work of the attributed author or publisher, and ZFIN has permission only to display this image to its users. Additional permissions should be obtained from the applicable author or publisher of the image. Full text @ Journal of Clin. Invest.