IMAGE

Figure 7

ID
ZDB-IMAGE-250417-118
Source
Figures for Oyarbide et al., 2025
Image
Figure Caption

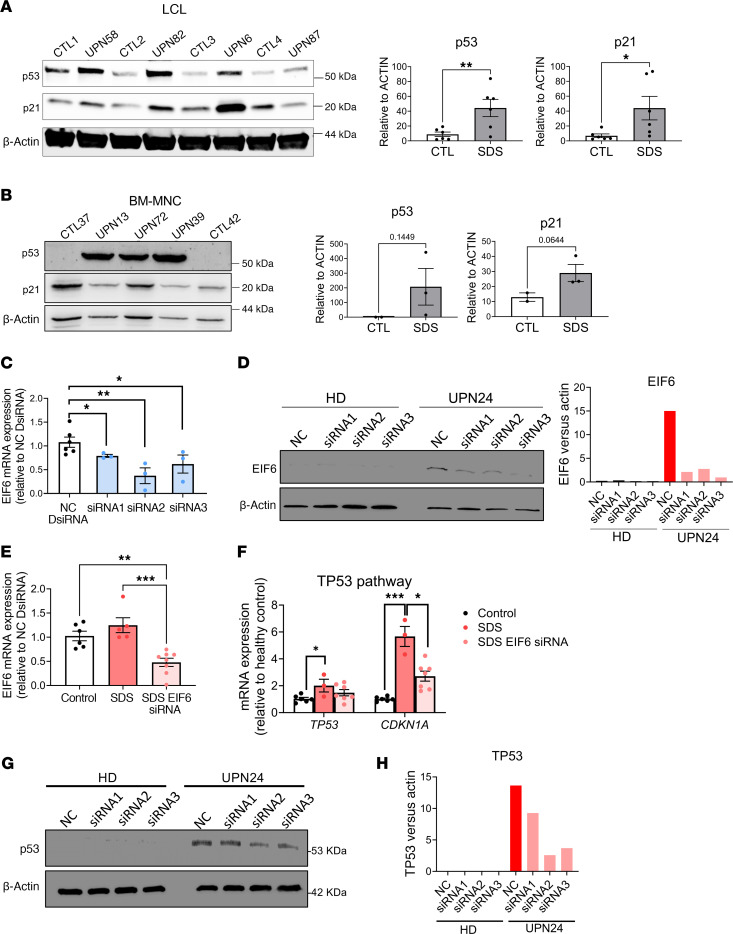
Figure 7 Tp53 activation in SDS patient–derived cells.

Western blots and quantification of (A) LCLs and (B) BM-MNCs. EIF6 mRNA (C) and protein (D) levels in 3 different siRNAs. (E) EIF6 mRNA levels in patients with SDS with and without siRNA (F) TP53 and CDKN1a mRNA levels are decreased after siRNA in patients with SDS. (G) Western blots showing decrease in TP53 levels after EIF6 knockdown using 3 different siRNAs. (H) TP53 protein quantification. Data represent the mean ± SEM. HD, healthy donor; NC, negative control.

Acknowledgments
This image is the copyrighted work of the attributed author or publisher, and ZFIN has permission only to display this image to its users. Additional permissions should be obtained from the applicable author or publisher of the image. Full text @ Journal of Clin. Invest.