
- Title
-
Therapeutic potential of hydrogen-rich water in zebrafish model of Alzheimer's disease: targeting oxidative stress, inflammation, and the gut-brain axis
- Authors
- He, J., Xu, P., Xu, T., Yu, H., Wang, L., Chen, R., Zhang, K., Yao, Y., Xie, Y., Yang, Q., Wu, W., Sun, D., Wu, D.
- Source
- Full text @ Front Aging Neurosci
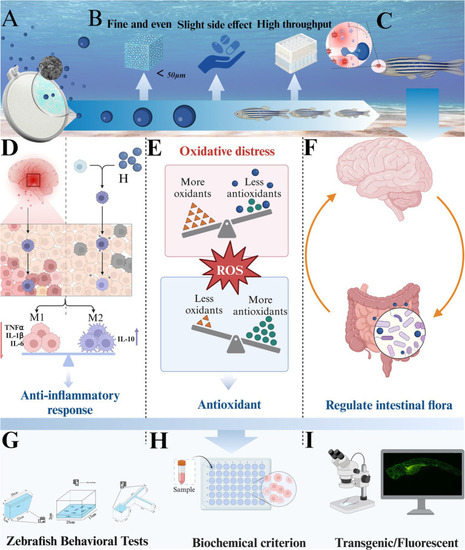
Experimental strategy and mechanism. |
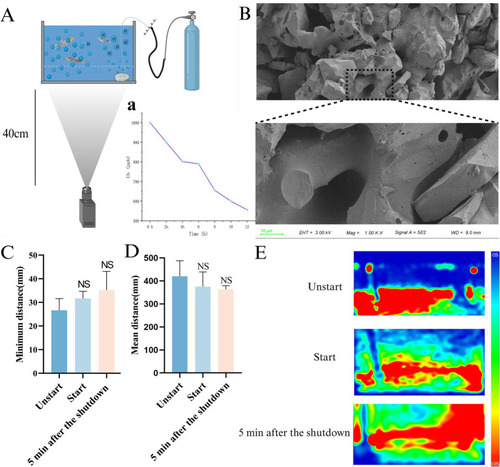
Device component schematic and safety verification. |
|
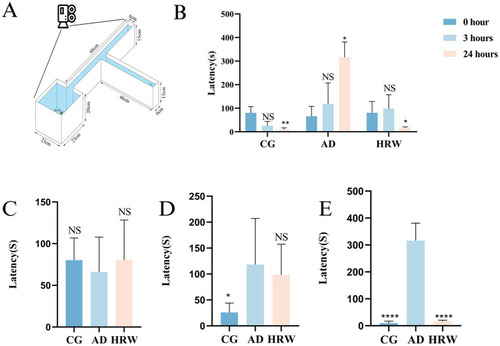
PHENOTYPE:
|
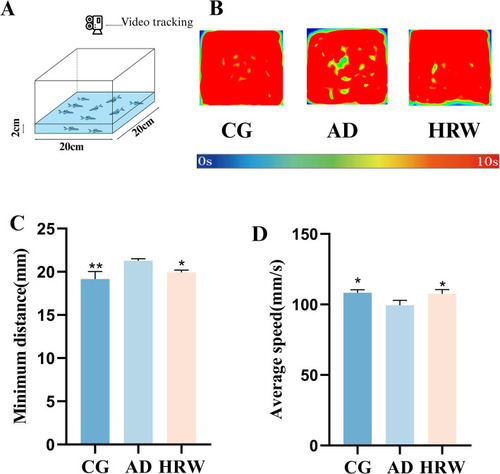
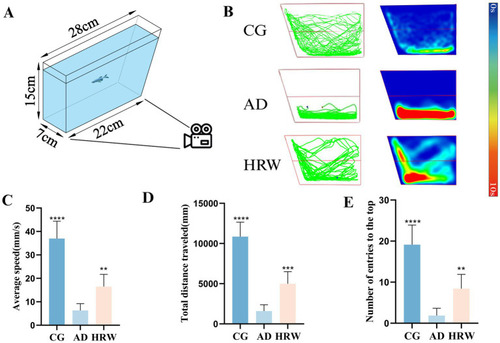
PHENOTYPE:
|

According to different zebrafish groups, the brain neutral particle fluorescence intensity, whole brain pathological section and whole brain tissue inflammatory factor levels. |

Detection of brain AD factor and liver sEHs in Zebrafish. PHENOTYPE:
|
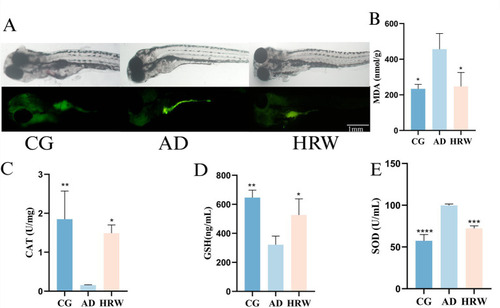
The whole brain oxidative stress factor and whole body ROS fluorescence intensity were analyzed according to different groups of zebrafish. |
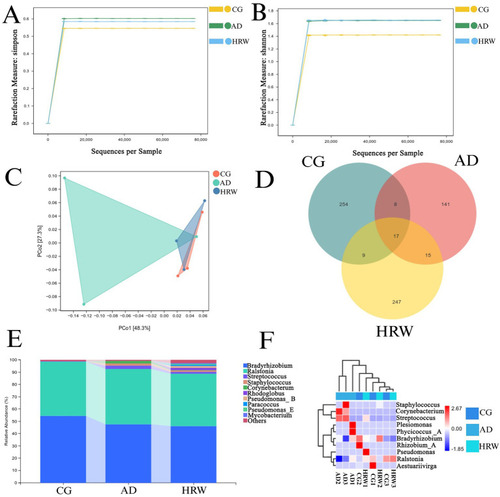
Effects of HRW on intestinal microorganisms of AD zebrafish. PHENOTYPE:
|
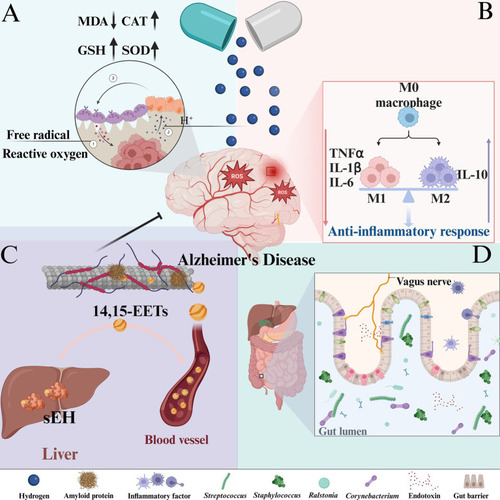
The mechanism of hydrogen-based therapy for AD: |