
FIGURE
Figure 2
- ID
- ZDB-FIG-250122-42
- Publication
- He et al., 2025 - Therapeutic potential of hydrogen-rich water in zebrafish model of Alzheimer's disease: targeting oxidative stress, inflammation, and the gut-brain axis
- Other Figures
- All Figure Page
- Back to All Figure Page
Figure 2
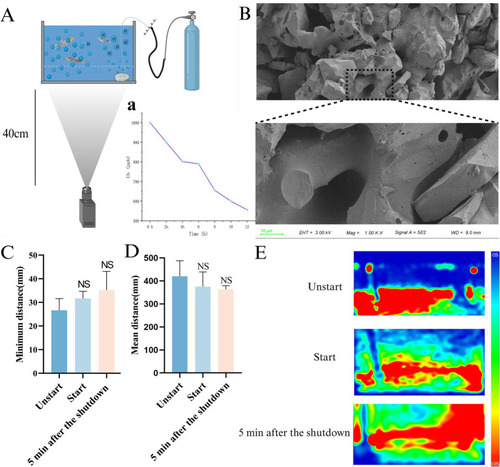
Device component schematic and safety verification. |
Expression Data
Expression Detail
Antibody Labeling
Phenotype Data
Phenotype Detail
Acknowledgments
This image is the copyrighted work of the attributed author or publisher, and
ZFIN has permission only to display this image to its users.
Additional permissions should be obtained from the applicable author or publisher of the image.
Full text @ Front Aging Neurosci