IMAGE

Figure 4

ID
ZDB-IMAGE-250122-44
Source
Figures for He et al., 2025
Image
Figure Caption

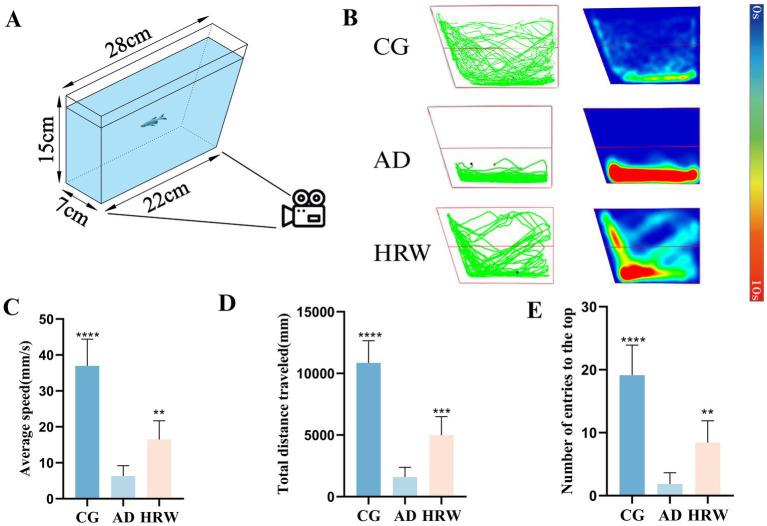
Figure 4

(A) Schematic diagram of NTT device. (B) Track chart and heat map of each group during capture time. (C) The average speed of each group. (D) The total distance traveled. (E) The number of entries the top. NTT (n = 7 per group). The data are expressed as the mean ± SEM and were analyzed by one-way ANOVA followed by Tukey’s post-hoc test. Significance was defined as follows versus AD group: *p < 0.05, **p < 0.01, ****p < 0.0001. NS, not significant.

Figure Data
Acknowledgments
This image is the copyrighted work of the attributed author or publisher, and ZFIN has permission only to display this image to its users. Additional permissions should be obtained from the applicable author or publisher of the image. Full text @ Front Aging Neurosci