
Image
|
Figure Caption
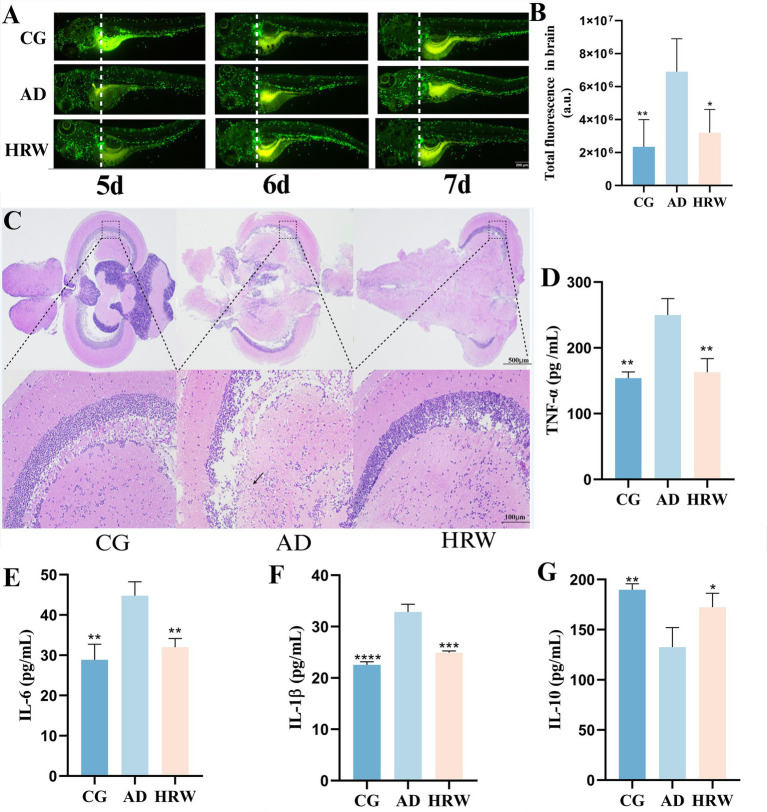
Figure 6
According to different zebrafish groups, the brain neutral particle fluorescence intensity, whole brain pathological section and whole brain tissue inflammatory factor levels.
Figure Data
Acknowledgments
This image is the copyrighted work of the attributed author or publisher, and
ZFIN has permission only to display this image to its users.
Additional permissions should be obtained from the applicable author or publisher of the image.
Full text @ Front Aging Neurosci