
- Title
-
Basement membranes are crucial for proper olfactory placode shape, position and boundary with the brain, and for olfactory axon development
- Authors
- Tignard, P., Pottin, K., Geeverding, A., Doulazmi, M., Cabrera, M., Fouquet, C., Liffran, M., Fouchard, J., Rosello, M., Albadri, S., Del Bene, F., Trembleau, A., Breau, M.A.
- Source
- Full text @ Elife

Expression profile of Laminin in relation with the development of the olfactory system. (A–D) Immunostaining for Laminin magenta on Tg(neurog1:GFP) embryos (green) at 18 and 22 hpf (A-B’, dorsal views), and on Tg(omp:meYFP) embryos (green) at 28 and 36 hpf (C-D’, frontal views). In A, white arrowheads = BM like Laminin staining around the brain, grey arrowheads = spotty Laminin accumulation around the OP. In C, D, asterisks = interruptions in the OP’s and brain’s BM where the YFP+ axons exit the OP and enter the brain. arrows = distalmost extremity of the YFP+ axon bundle, which is in close contact with the internal side of the brain’s BM. In (C’, D’), white arrowheads = ventro-medial unipolar neurons labelled by the Tg(omp:meYFP) line (see Miyasaka et al., 2005). All the images are single z-sections. (E–J) Images extracted from confocal live imaging on TgBAC(lamC1:lamC1-sfGFP); Tg(cldnb:Gal4; UAS:RFP) embryos (frontal view, except for J), dorsal view. LamC1-sfGFP expression in green, and RFP expression (OP cells and peridermal skin cells) in magenta. Arrowheads = OP cells with cytoplasmic LamC1-sfGFP accumulation. Asterisks in F and H=axon exit point and entry point, respectively. Arrows in H and I=distalmost extremity of the RFP+ axon bundle, located close to the brain’s BM. In J, double headed arrow = gap in the LamC1-sfGFP observed at the interface with the periderm, where the nostril orifice opens in the skin, as previously reported (Baraban et al., 2023). All the images are single z-sections. (K) Schematic representation of Laminin-containing BM (magenta) assembly during OP coalescence (a, b) of the formation of the exit/entry points, which often appear as zones with several, small BM interruptions (b, d) and the associated axonal behaviours: retrograde axon extension and lateral movement in the OP (a, b, grey arrows), growth as a fasciculated bundle, initially between the BMs of the OP and the brain (c), and then migration of the axonal tips along the internal side of the brain’s BM (d) Scale bar: 50 µm. |
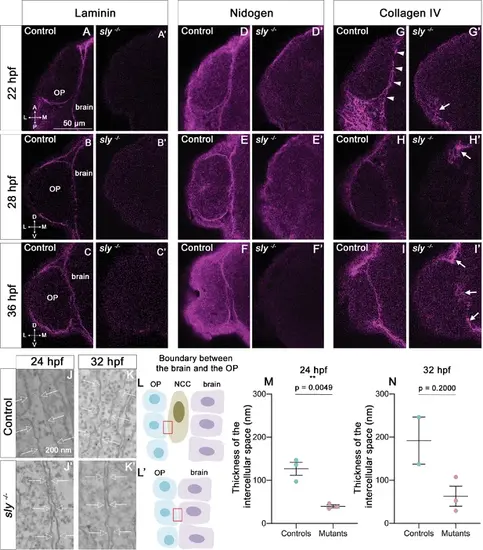
The integrity of the BMs of OP and brain tissues is strongly affected in sly mutants. (A–I) Immunostaining for Laminin (A–C), Nidogen (D–F) and Collagen IV (G–I) (magenta) on sly mutants and control siblings at 22 (dorsal view), 28, and 36 hpf (frontal view). For Laminin and Nidogen, the linear, BM-like staining seen in controls around the OP and brain tissues is not detected in sly mutants. In G, white arrowheads = BM like linear Collagen IV staining, grey arrowheads = fibrous staining around the OP. In sly mutants, the linear Collagen IV pattern is dramatically disrupted, with, however, remaining fibrous patches of Collagen IV in some discrete areas located at the margin of the OP and/or between the OP and brain (arrows in G’, H’, I’) Scale bar: 50 µm. (J, K). Examples of EM images of the intercellular space between NCC and the OP in control siblings (J, K) and the OP and the brain in sly mutants (J’, K’), at 24 (J, J’) and 32 hpf (K, K’). Arrows = plasma membranes. The pictures were taken in the areas depicted with red boxes in L, L’. (L) Schematic view of the brain/OP boundary and of the areas (red boxes) where the pictures were taken in controls (L) and sly mutants (L’). OP, brain and NCC were identified by their position and shape: migrating NCC showed an elongated morphology along the AP axis, which differed from the round OP cell bodies and from brain neuroepithelial cells elongated along the ML axis. (M, N) Thickness of the intercellular space in sly mutants (between OP and brain cells) and control siblings (between NCC and brain or OP cells) at 24 hpf (n=3 controls; n=3 mutants) and 32 hpf (n=2 controls; n=3 mutants). For 24 hpf, unpaired, two-tailed t test. For 32 hpf, Mann-Whitney test. |
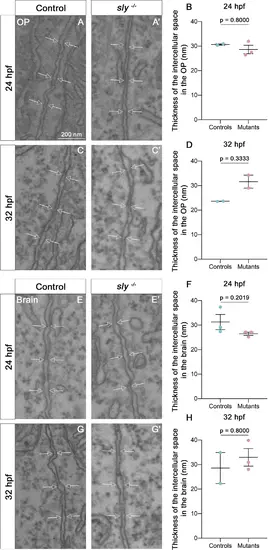
Electron microscopy analysis of intercellular spaces in the OP and brain tissues. A, A’ and C, C’ Examples of images of the intercellular space located between OP cells in control siblings (A, C) and in sly mutants (A’, C’), at 24 and 32 hpf. Arrows = plasma membranes. (B, D) Thickness of the intercellular space in the OP tissue in sly mutants and control siblings at 24 (n=2 controls; n=3 mutants) and 32 hpf (n=2 controls; n=2 mutants). (E, E’ and G, G’) Examples of images of the intercellular space located between brain cells in control siblings (A, C) and in sly mutants (A’, C’), at 24 and 32 hpf. Arrows = plasma membranes. (F, H) Thickness of the intercellular space in the brain tissue in sly mutants and control siblings at 24 (n=3 controls; n=3 mutants) and 32 hpf (n=2 controls; n=3 mutants). Mann Whitney tests except for F: unpaired, two-tailed t-test. |
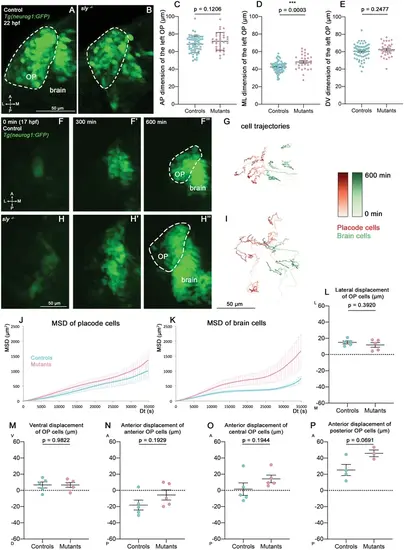
Analysis of OP coalescence in sly mutants and control siblings. (A, B) Images (dorsal views, 1 z-section) of representative OPs from a Tg(neurog1:GFP); sly -/- mutant (right) and a control Tg(neurog1:GFP) sibling (left) at the end of OP coalescence (22 hpf). The Tg(neurog1:GFP)+ OP clusters are surrounded by dotted lines. (C–E) Graphs showing the anteroposterior (AP, in C), the mediolateral (ML, in D), and dorsoventral (DV, in E) dimensions of the Tg(neurog1:GFP)+ OP clusters in sly mutants (pink) and control siblings (blue) at 22 hpf (n=62 controls and n=32 mutants from two independent experiments). Ectopic fluorescent cells (cells that are physically separated from the main cluster) were not taken into account for the measurement of OP dimensions. Unpaired, two-tailed t test. (F-F’’ and H-H’) Images extracted from confocal live imaging on Tg(neurog1:GFP) control (F-F’’) and sly mutant (H-H’’) embryos during OP coalescence, dorsal view, average projection. Only the left side of the embryo is shown. (G, I) Examples of 2D tracks (ML along X and AP along Y) of Tg(neurog1:GFP)+ OP cells (red) and Tg(neurog1:GFP)+ brain cells (green) in a control (G) and a sly mutant embryo (I) Only the left side of the embryo is shown. The time is colour-coded: light colours at the beginning of the trajectory (17 hpf) towards dark colours for the end of the track (600 min later). (J, K) MSD analysis for OP cells (J) and brain cells (K) in sly mutants and control siblings (n=5 controls and n=5 mutants from three independent experiments, 10–14 cells analysed in each tissue). (L, M) Graphs showing the total lateral (L) and ventral (M) displacement of OP cells, starting at 17 hpf and during 600 min of time lapse (n=5 control placodes and n=5 mutant placodes from three independent experiments, 10–14 cells per placode, unpaired, two-tailed t test). (N–P) Graphs showing the total anterior displacement of anterior, central and posterior OP cells (as defined in Breau et al., 2017), starting at 17 hpf and during 600 min of time lapse (n=5 control placodes and n=5 mutant placodes from three independent experiments, mean calculated from 1 to 12 cells per placode, unpaired, two-tailed t test). Note that in some of the OPs we could not find any trackable (i.e. expressing H2B-RFP) posterior OP cell, which explains why there are only 4 control points and 3 mutant points in the graph showing the anterior displacement of posterior cells. |

Analysis of proliferation and apoptosis in the OPs of sly mutants and control siblings. (A-D’) Immunostaining for Phospho-histone H3 (magenta) to label dividing cells on Tg(neurog1:GFP) embryos (green) at 16 hpf and 21 hpf (A-B’ show images at 21 hpf, dorsal view), and on Tg(omp:meYFP) embryos (green) at 28 and 36 hpf (C-D’ show images at 36 hpf, frontal view). In A-B’ the OP is surrounded by a dotted line. Arrows = instances of Phospho-histone H3 positive cells in the placodal Tg(neurog1:GFP)+ or Tg(omp:meYFP)+ clusters. (E–H) Number of Phospho-histone H3 positive cells in the OP at 16 hpf (n=19 controls; n=8 mutants), 21 hpf (n=21 controls; n=6 mutants), 28 hpf (n=8 controls; n=7 mutants) and 36 hpf (n=9 controls; n=9 mutants) in control embryos and sly mutants. Unpaired, two-tailed t test. (I-L’) Immunostaining for Activated Caspase 3 (magenta) to label apoptotic cells/debris on Tg(neurog1:GFP) embryos (green) at 16 hpf and 21 hpf (I-J’ show images at 21 hpf, dorsal view), and on Tg(omp:meYFP) embryos (green) at 28 and 36 hpf (K-L’ show images at 36 hpf, frontal view). In I-J’ the OP is surrounded by a dotted line. Arrows = instances of Activated Caspase 3 positive cells or debris in the OP or in contact with the placodal Tg(neurog1:GFP)+ or Tg(omp:meYFP)+ clusters. (M–P) % of left OPs with zero, one or two and more Activated Caspase 3 positive cells or debris in the OP or very close to the OP at 16 hpf (n=25 controls; n=9 mutants), 21 hpf (n=25 controls; n=9 mutants), 28 hpf (n=8 controls; n=10 mutants) and 36 hpf (n=10 controls; n=10 mutants) in control embryos and sly mutants. Chi2 test. (Q, R) Total number of YFP+ cells in control and mutant Tg(omp:meYFP)+ OPs at 28 hpf (Q) and 36 hpf (R) (n=3 control placodes; n=3 mutant placodes for each stage). Unpaired, two-tailed t test. |
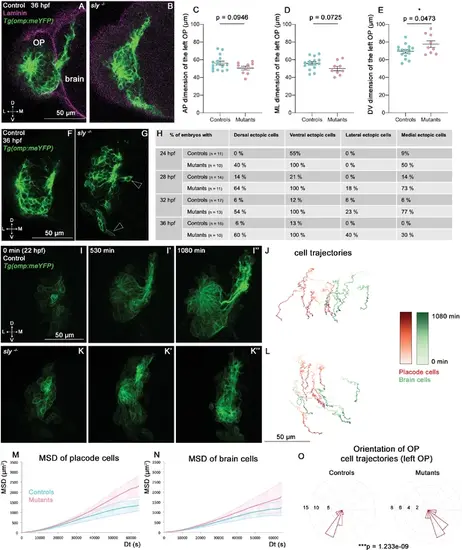
Analysis of OP and brain morphogenesis in sly mutants and control siblings during the forebrain flexure. (A, B) Images (frontal view, 1 z-section) of representative placodes from a Tg(omp:meYFP); sly -/- mutant (right) and a control Tg(omp:meYFP) sibling (left) at 36 hpf. Laminin immunostaining in magenta. (C–E) Graphs showing the anteroposterior (AP, in C), the mediolateral (ML, in D), and dorsoventral (DV, in E) dimensions of the Tg(omp:meYFP)+ OP clusters in sly mutants (pink) and control siblings (blue) at 36 hpf (n=15 controls and n=9 mutants from four independent experiments). Ectopic fluorescent cells (cells that are physically separated from the main cluster) were not taken into account for the measurement of OP dimensions. Unpaired, two-tailed t test. Similar measurements performed at younger stages are shown in Figure 4—figure supplement 1A–L. (F, G) Examples of images used for the analysis of ectopic cells, defined as Tg(omp:meYFP)+ cells being physically separated from the main YFP+ cluster. Arrowheads show instances of ectopic cells in a sly mutant. (H) Table showing the % of control and mutant embryos with at least one ectopic cell located dorsally, ventrally, laterally, and medially to the main YFP+ cluster. The numbers of analysed embryos are indicated in the table. (I-I’’ and K-K’’) Images extracted from confocal live imaging on Tg(omp:meYFP) control (I-I’’) and sly mutant (K-K’’) embryos during the forebrain flexure, from 22 hpf and over 1080 min, frontal view, maximum projection. Only the left side of the embryo is shown. (J, L) Examples of 2D tracks (ML along X and DV along Y) of Tg(omp:meYFP)+ OP cells (red) and adjacent brain cells (green) in a control (J) and a sly mutant (L). The time is colour-coded: light colours at the beginning of the trajectory (22 hpf) towards dark colours for the end of the track (1080 min later). Only the left side of the embryo is shown. (M, N) 3D MSD analysis of OP (M) and brain cells (N) in sly mutants and control siblings (n=4 controls and n=3 mutants from five independent experiments, 10–14 cells analysed in each tissue). (O) Rose plots indicating the orientation of the movement for control and mutant left OP cells (data pooled from n=4 controls and n=3 mutants from five independent experiments). Numbers = number of cells. Dorsal to the top, lateral to the left. There is a statistical difference in cell track orientations between controls and mutants (circular analysis of variance based on the likelihood ratio test: p=1.233e-09 for the left OPs, and p=3.439e-08 for the right OPs, the graphs for the rigth OPs are not shown). |
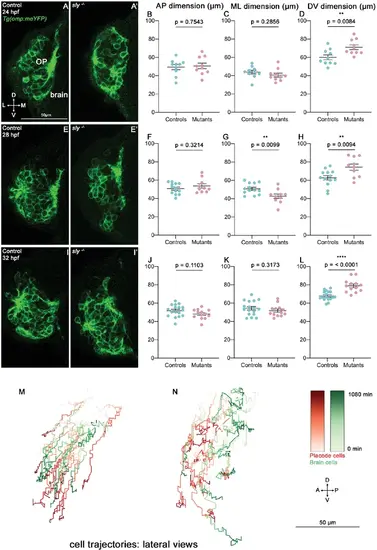
Additional results on the OP morphogenesis defects observed in sly mutants. (A-L) Analysis of OP dimensions at 24, 28, and 32 hpf. (A, A’, E, E’ and I, I’) Images (frontal views, 1 z-section) of representative OPs from Tg(omp:meYFP); sly -/- mutants (right) and control Tg(omp:meYFP) siblings (left) at 24 (A, A’), 28 (E, E’) and 32 hpf (I, I’). B–D Graphs showing the AP, ML, and DV dimensions of the Tg(omp:meYFP)+ OP clusters in sly mutants and control siblings at 24 hpf (n=10 controls and n=10 mutants from three independent experiments). Ectopic fluorescent cells (cells that are physically separated from the main cluster) were not taken into account for the measurement of OP dimensions. Unpaired, two-tailed t test. (F–H). Similar quantifications at 28 hpf (n=13 controls and n=10 mutants from two independent experiments). Unpaired, two-tailed t tests. (J–L). Similar quantifications at 32 hpf (n=17 controls and n=13 mutants from two independent experiments). Unpaired, two-tailed t tests. Quantifications performed at 36 hpf are shown in Figure 4C–E. (M, N) Examples of 2D tracks plotted in a lateral view (AP along X and DV along Y) of Tg(omp:meYFP)+ OP cells (red) and adjacent brain cells (green) in a control (M) and a sly mutant embryo (N). The time is colour-coded: light colours at the beginning of the trajectory (22 hpf) towards dark colours for the end of the track (1080 min later). |
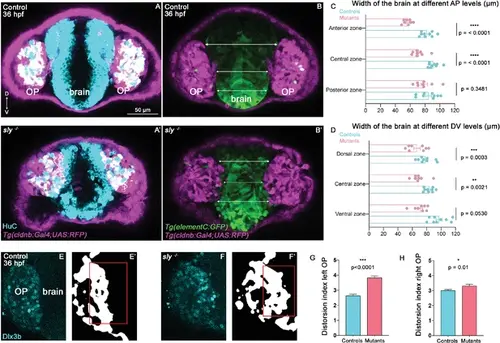
Analysis of brain width and brain/placode boundary in sly mutants and control siblings. (A, A’) Immunostaining for HuC (cyan) at 36 hpf on Tg(cldnb:Gal4; UAS:RFP) (magenta) control and sly mutant embryos (frontal view). Similar immunostainings performed at 28 hpf are shown in Figure 5—figure supplement 1A, A’. (B, B’). Images of Tg(elementC:gfp); Tg(cldnb:Gal4; UAS:RFP) control and mutant embryos at 36 hpf (frontal view), similar images acquired at 28 hpf are shown in Figure 5—figure supplement 1B, B’. GFP (green) is expressed by the forebrain and a few OP cells. Arrows indicate where the brain width was measured (in three distinct positions along the DV axis). Measurements were also carried out at three distinct AP levels (through the z-stack). (C, D) Width of the forebrain in 36 hpf controls and sly mutants, at three different DV and three different AP levels (n=9 controls and n=8 mutants from four independent experiments, unpaired, two-tailed t test). Quantifications for the 28 hpf stage are shown in Figure 5—figure supplement 1C, D. (E-F’) Immunostaining for the OP marker Dlx3b (cyan) was performed on 36 hpf sly mutants and control siblings (frontal view). The signal was segmented using deep learning approaches (white signal), and the distortion index (see Materials and methods) of the OP/brain boundary was calculated in the regions outlined with red boxes. (G, H) Graphs showing the distortion indexes in controls and mutants at 36 hpf, for the left and right OPs (n=3 controls and n=3 mutants). ANOVA test (mixed models, with animals as random effect and genotype and side as fixed effects). |
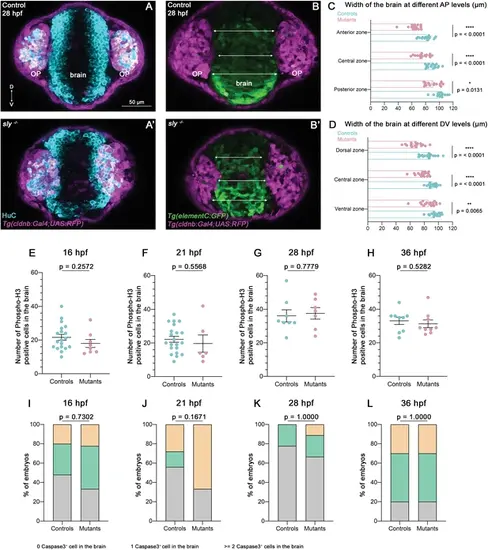
Additional results for the analysis of brain shape and proliferation/apoptosis in sly mutants and control siblings. (A, A’) Immunostaining for HuC (cyan) at 28 hpf performed on Tg(cldnb:Gal4; UAS:RFP) (magenta) control and sly mutant embryos (frontal view). Similar immunostainings performed at 36 hpf are shown in Figure 5A and A’. (B, B’). Images of Tg(elementC:gfp); Tg(cldnb:Gal4; UAS:RFP) control and mutant embryos at 28 hpf (frontal view), similar images acquired at 36 hpf are shown in Figure 5B and B’. GFP (green) is expressed by the forebrain, and a few OP cells. Arrows indicate where the thickness of the forebrain was measured (in three distinct positions along the DV axis). Measurements were also carried out at three distinct AP levels (through the z-stack). (C, D) Width of the forebrain in 28 hpf controls and sly mutants, at three different DV and three different AP levels (n=17 controls and n=17 mutants from five independent experiments, unpaired, two-tailed t tests except for anterior and posterior zones, for which a Mann-Whitney test was applied). Quantifications for the 28 hpf stage are shown in Figure 5C and D. (E–H) Number of Phospho-histone H3 positive cells in the brain at 16, 21, 28, and 36 hpf in control embryos and sly mutants. Unpaired, two-tailed t test. (I–L) % of embryos with zero, one, or two and more Activated Caspase 3 positive cells or debris in the brain at 16, 21, 28, and 36 hpf in control embryos and sly mutants. Chi2 test. |

NCC defects in sly mutants. (A, A’) In situ hybridisation for the NCC marker crestin on 32 hpf controls and sly mutants. Arrowheads = crestin-positive NCC cluster at the OP/brain interface, which is absent in sly mutants. (B) Table reporting our observations from live imaging of cranial NCC migration in sly mutants and control siblings (see Figure 5—video 2). Confocal live imaging was performed from 16 to 32 hpf on sly mutant and control Tg(neurog1:GFP);Tg(UAS:RFP) embryos injected with the sox10(7.2):KalTA4 plasmid, allowing a mosaïc labelling of NCC. |
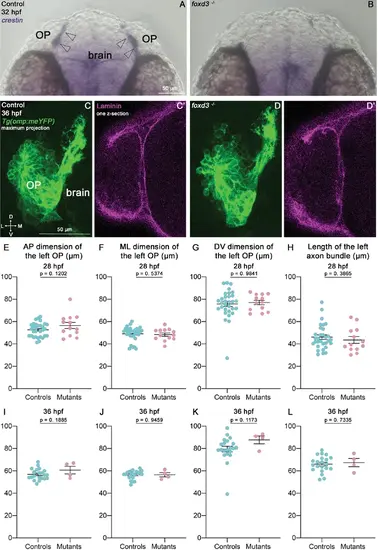
Olfactory system development in foxd3 mutants. (A, B) In situ hybridisation for the NCC marker crestin on 32 hpf controls and foxd3 mutants. Arrowheads = crestin-positive NCC cluster at the OP/brain interface, which is absent in foxd3 mutants. (C, D). Images (frontal view, maximum projection) of representative OPs of Tg(omp:meYFP); foxd3 -/- mutants and control siblings. (C’, D’) Laminin immunostaining (1 z-section) on the same embryos. (E–H) OP dimensions and length of the axon bundle at 28 hpf in foxd3 mutants and control siblings (n=31 controls and n=13 mutants from two independent experiments). (I–L) OP dimensions and length of the axon bundle in foxd3 mutants and control siblings at 36 hpf (n=21 controls and n=4 mutants from two independent experiments). Unpaired, two-tailed t tests for E, I, J, L and Mann-Whitney tests for F, G, H, K. |
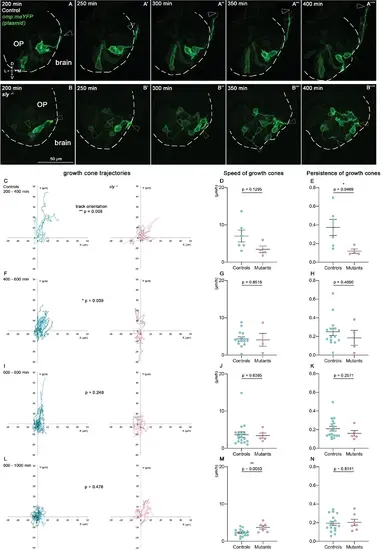
Quantitative live imaging of axonal behaviours in sly mutants and control siblings. (A, B) Images extracted from confocal live imaging on control (A-A’’’’) and sly mutant (B-B’’’’) embryos injected with the omp:meYFP plasmid to obtain a mosaic labelling of OP neurons and their axons (frontal view, maximum projections). The OP neurons and their axons were imaged every 10 min over 1000 min from 22 hpf. Here, only the 200–400 min time window is shown as an example. Arrowheads = positions of individual growth cones over time. (C–N). Individual YFP+ growth cones, as well as YFP+ cell bodies in the OP, were tracked during 4 consecutive periods of 200 min each (from 200 min of imaging, since before no growth cone could be detected, n=5 mutants and n=5 controls from six independent experiments). The mean movement of OP cell bodies was substracted from the growth cone tracks to get rid of the global flexure movement. 200–400 min: 6 growth cones in controls, 4 in mutants; 400–600 min: 15 growth cones in controls, 4 in mutants; 600–800 min: 18 growth cones in controls, 4 in mutants; 800–1000 min: 16 growth cones in controls, 7 in mutants. (C, F, I, L) Tracks of the growth cones merged at their origin for the 4 consecutive periods of 200 min. For each time window, the difference in the orientation of the tracks was analysed using the circular analysis of variance based on the likelihood ratio test. (D, G, J, M) Mean speed of the growth cones. Unpaired, two-tailed t tests. (E, H, K, N) Persistence of the growth cones, defined as the distance between the initial and final positions of the growth cones divided by the total length of their trajectory. Unpaired, two-tailed t tests, except for the analysis of the persistence at 400–600 min, and for the speed and persistence at 600–800 min, where Mann-Whitney tests were performed. |

Additional results on olfactory axon development in sly mutants and control siblings. (A, B) Images extracted from confocal live imaging experiments performed during OP coalescence on Tg(cldnb:Gal4; UAS:RFP) embryos injected with the neurog1:GFP plasmid, allowing a sparse labelling of neurog1:GFP +neurons/axons. The pictures illustrate instances of retrograde axon extension/cell body mediolateral movement occuring in a sly mutant and a control sibling. Arrows = proximal portions of the axons extending in the OP. Dotted line = brain/OP boundary (identified with the RFP signal which is not shown here). op = olfactory placode, b=brain. Scale bar: 20 µm. (C–F) Images (frontal view, 1 z-section) of representative OPs from Tg(omp:meYFP); sly -/- mutant (E, F) and control Tg(omp:meYFP) siblings (C, D) at 24 hpf. Arrows = instances of proximal portions of the axons in the OP. (G) Table describing the % of control and sly mutant Tg(omp:meYFP) embryos with a proper axonal bundle (left column), with at least one ventral projection (middle column) and with at least one medial projection (right column) at 24, 28, 32 and 36 hpf. The numbers of embryos analysed at each stage are indicated in the table. The schematic view under the table illustrates the phenotypes assessed in each column. Note that in the mutants, as shown on the schematics, when a proper axon bundle is observed (left column), the exit point of the axons is more dorsal than in controls (see Figure 4A, B, Figure 4—figure supplement 1E’ for instance). |