
|
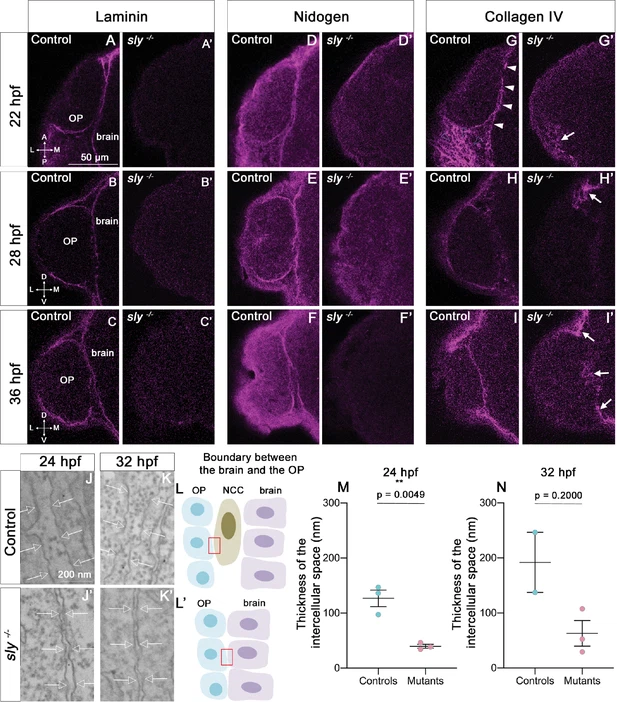
Fig. 2 The integrity of the BMs of OP and brain tissues is strongly affected in sly mutants. (A–I) Immunostaining for Laminin (A–C), Nidogen (D–F) and Collagen IV (G–I) (magenta) on sly mutants and control siblings at 22 (dorsal view), 28, and 36 hpf (frontal view). For Laminin and Nidogen, the linear, BM-like staining seen in controls around the OP and brain tissues is not detected in sly mutants. In G, white arrowheads = BM like linear Collagen IV staining, grey arrowheads = fibrous staining around the OP. In sly mutants, the linear Collagen IV pattern is dramatically disrupted, with, however, remaining fibrous patches of Collagen IV in some discrete areas located at the margin of the OP and/or between the OP and brain (arrows in G’, H’, I’) Scale bar: 50 µm. (J, K). Examples of EM images of the intercellular space between NCC and the OP in control siblings (J, K) and the OP and the brain in sly mutants (J’, K’), at 24 (J, J’) and 32 hpf (K, K’). Arrows = plasma membranes. The pictures were taken in the areas depicted with red boxes in L, L’. (L) Schematic view of the brain/OP boundary and of the areas (red boxes) where the pictures were taken in controls (L) and sly mutants (L’). OP, brain and NCC were identified by their position and shape: migrating NCC showed an elongated morphology along the AP axis, which differed from the round OP cell bodies and from brain neuroepithelial cells elongated along the ML axis. (M, N) Thickness of the intercellular space in sly mutants (between OP and brain cells) and control siblings (between NCC and brain or OP cells) at 24 hpf (n=3 controls; n=3 mutants) and 32 hpf (n=2 controls; n=3 mutants). For 24 hpf, unpaired, two-tailed t test. For 32 hpf, Mann-Whitney test.