
|
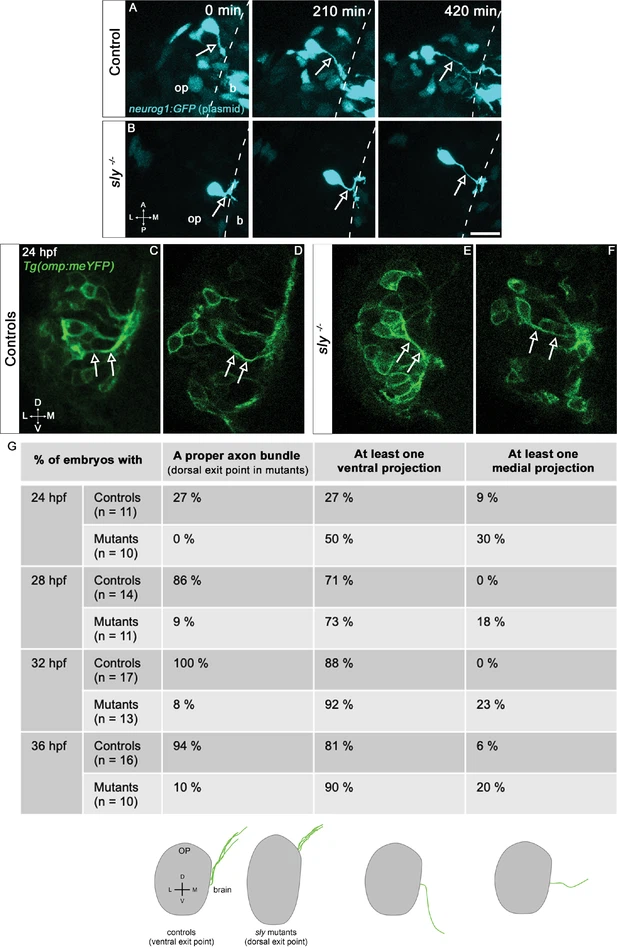
Fig. 6 - Supplemental 1 Additional results on olfactory axon development in sly mutants and control siblings. (A, B) Images extracted from confocal live imaging experiments performed during OP coalescence on Tg(cldnb:Gal4; UAS:RFP) embryos injected with the neurog1:GFP plasmid, allowing a sparse labelling of neurog1:GFP +neurons/axons. The pictures illustrate instances of retrograde axon extension/cell body mediolateral movement occuring in a sly mutant and a control sibling. Arrows = proximal portions of the axons extending in the OP. Dotted line = brain/OP boundary (identified with the RFP signal which is not shown here). op = olfactory placode, b=brain. Scale bar: 20 µm. (C–F) Images (frontal view, 1 z-section) of representative OPs from Tg(omp:meYFP); sly -/- mutant (E, F) and control Tg(omp:meYFP) siblings (C, D) at 24 hpf. Arrows = instances of proximal portions of the axons in the OP. (G) Table describing the % of control and sly mutant Tg(omp:meYFP) embryos with a proper axonal bundle (left column), with at least one ventral projection (middle column) and with at least one medial projection (right column) at 24, 28, 32 and 36 hpf. The numbers of embryos analysed at each stage are indicated in the table. The schematic view under the table illustrates the phenotypes assessed in each column. Note that in the mutants, as shown on the schematics, when a proper axon bundle is observed (left column), the exit point of the axons is more dorsal than in controls (see Figure 4A, B, Figure 4—figure supplement 1E’ for instance).