
|
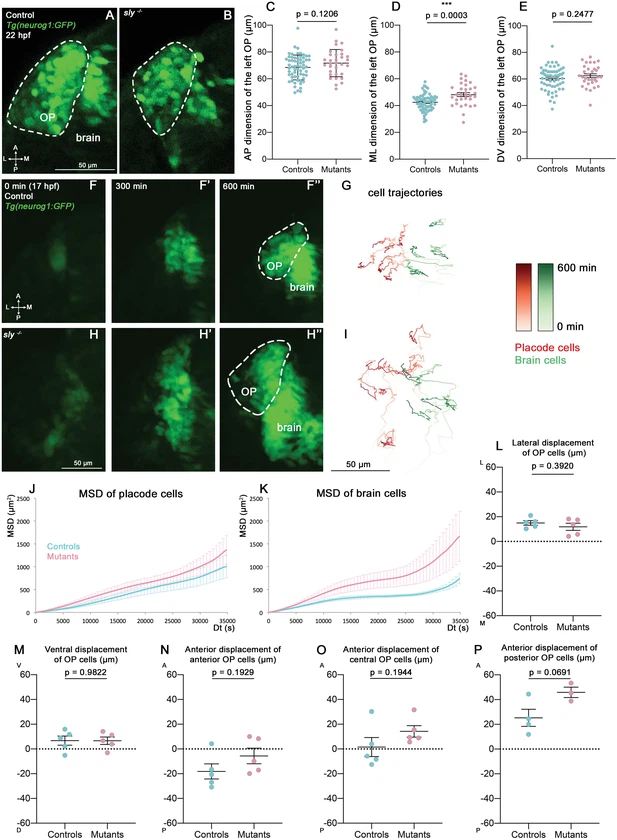
Fig. 3 Analysis of OP coalescence in sly mutants and control siblings. (A, B) Images (dorsal views, 1 z-section) of representative OPs from a Tg(neurog1:GFP); sly -/- mutant (right) and a control Tg(neurog1:GFP) sibling (left) at the end of OP coalescence (22 hpf). The Tg(neurog1:GFP)+ OP clusters are surrounded by dotted lines. (C–E) Graphs showing the anteroposterior (AP, in C), the mediolateral (ML, in D), and dorsoventral (DV, in E) dimensions of the Tg(neurog1:GFP)+ OP clusters in sly mutants (pink) and control siblings (blue) at 22 hpf (n=62 controls and n=32 mutants from two independent experiments). Ectopic fluorescent cells (cells that are physically separated from the main cluster) were not taken into account for the measurement of OP dimensions. Unpaired, two-tailed t test. (F-F’’ and H-H’) Images extracted from confocal live imaging on Tg(neurog1:GFP) control (F-F’’) and sly mutant (H-H’’) embryos during OP coalescence, dorsal view, average projection. Only the left side of the embryo is shown. (G, I) Examples of 2D tracks (ML along X and AP along Y) of Tg(neurog1:GFP)+ OP cells (red) and Tg(neurog1:GFP)+ brain cells (green) in a control (G) and a sly mutant embryo (I) Only the left side of the embryo is shown. The time is colour-coded: light colours at the beginning of the trajectory (17 hpf) towards dark colours for the end of the track (600 min later). (J, K) MSD analysis for OP cells (J) and brain cells (K) in sly mutants and control siblings (n=5 controls and n=5 mutants from three independent experiments, 10–14 cells analysed in each tissue). (L, M) Graphs showing the total lateral (L) and ventral (M) displacement of OP cells, starting at 17 hpf and during 600 min of time lapse (n=5 control placodes and n=5 mutant placodes from three independent experiments, 10–14 cells per placode, unpaired, two-tailed t test). (N–P) Graphs showing the total anterior displacement of anterior, central and posterior OP cells (as defined in Breau et al., 2017), starting at 17 hpf and during 600 min of time lapse (n=5 control placodes and n=5 mutant placodes from three independent experiments, mean calculated from 1 to 12 cells per placode, unpaired, two-tailed t test). Note that in some of the OPs we could not find any trackable (i.e. expressing H2B-RFP) posterior OP cell, which explains why there are only 4 control points and 3 mutant points in the graph showing the anterior displacement of posterior cells.