
|
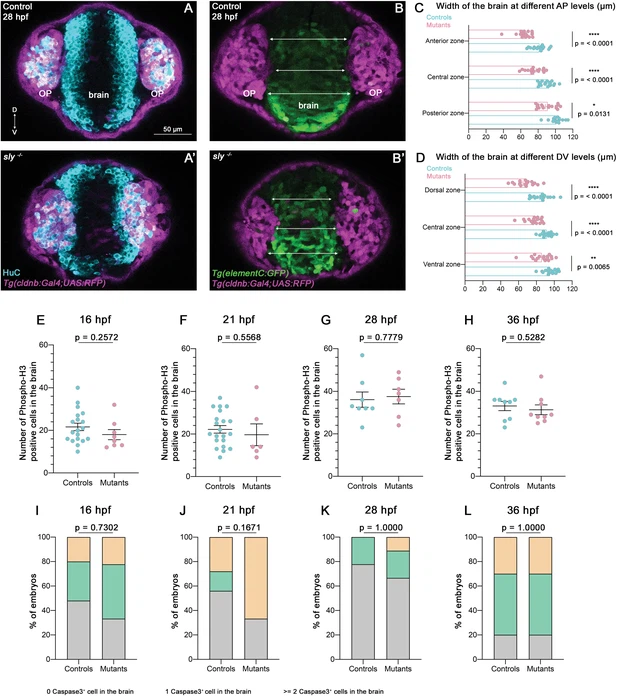
Fig. 5 - Supplemental 1 Additional results for the analysis of brain shape and proliferation/apoptosis in sly mutants and control siblings. (A, A’) Immunostaining for HuC (cyan) at 28 hpf performed on Tg(cldnb:Gal4; UAS:RFP) (magenta) control and sly mutant embryos (frontal view). Similar immunostainings performed at 36 hpf are shown in Figure 5A and A’. (B, B’). Images of Tg(elementC:gfp); Tg(cldnb:Gal4; UAS:RFP) control and mutant embryos at 28 hpf (frontal view), similar images acquired at 36 hpf are shown in Figure 5B and B’. GFP (green) is expressed by the forebrain, and a few OP cells. Arrows indicate where the thickness of the forebrain was measured (in three distinct positions along the DV axis). Measurements were also carried out at three distinct AP levels (through the z-stack). (C, D) Width of the forebrain in 28 hpf controls and sly mutants, at three different DV and three different AP levels (n=17 controls and n=17 mutants from five independent experiments, unpaired, two-tailed t tests except for anterior and posterior zones, for which a Mann-Whitney test was applied). Quantifications for the 28 hpf stage are shown in Figure 5C and D. (E–H) Number of Phospho-histone H3 positive cells in the brain at 16, 21, 28, and 36 hpf in control embryos and sly mutants. Unpaired, two-tailed t test. (I–L) % of embryos with zero, one, or two and more Activated Caspase 3 positive cells or debris in the brain at 16, 21, 28, and 36 hpf in control embryos and sly mutants. Chi2 test.