
|
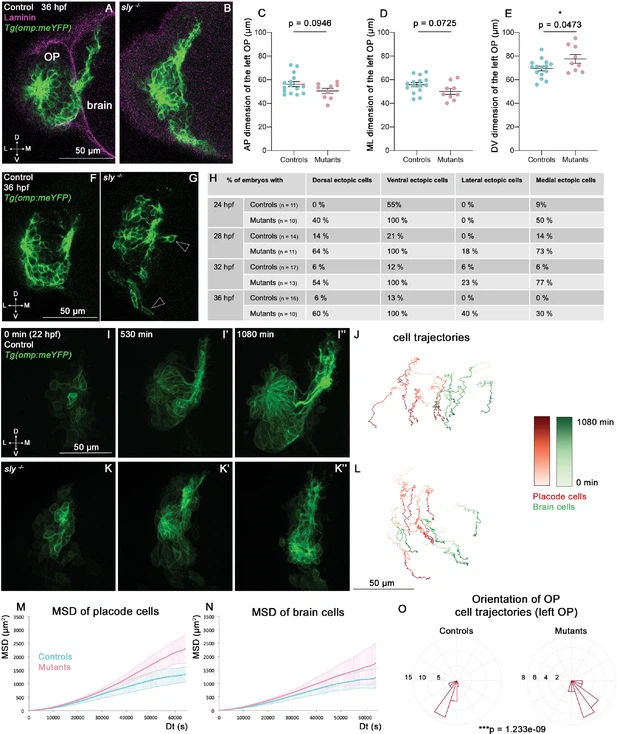
Fig. 4 Analysis of OP and brain morphogenesis in sly mutants and control siblings during the forebrain flexure. (A, B) Images (frontal view, 1 z-section) of representative placodes from a Tg(omp:meYFP); sly -/- mutant (right) and a control Tg(omp:meYFP) sibling (left) at 36 hpf. Laminin immunostaining in magenta. (C–E) Graphs showing the anteroposterior (AP, in C), the mediolateral (ML, in D), and dorsoventral (DV, in E) dimensions of the Tg(omp:meYFP)+ OP clusters in sly mutants (pink) and control siblings (blue) at 36 hpf (n=15 controls and n=9 mutants from four independent experiments). Ectopic fluorescent cells (cells that are physically separated from the main cluster) were not taken into account for the measurement of OP dimensions. Unpaired, two-tailed t test. Similar measurements performed at younger stages are shown in Figure 4—figure supplement 1A–L. (F, G) Examples of images used for the analysis of ectopic cells, defined as Tg(omp:meYFP)+ cells being physically separated from the main YFP+ cluster. Arrowheads show instances of ectopic cells in a sly mutant. (H) Table showing the % of control and mutant embryos with at least one ectopic cell located dorsally, ventrally, laterally, and medially to the main YFP+ cluster. The numbers of analysed embryos are indicated in the table. (I-I’’ and K-K’’) Images extracted from confocal live imaging on Tg(omp:meYFP) control (I-I’’) and sly mutant (K-K’’) embryos during the forebrain flexure, from 22 hpf and over 1080 min, frontal view, maximum projection. Only the left side of the embryo is shown. (J, L) Examples of 2D tracks (ML along X and DV along Y) of Tg(omp:meYFP)+ OP cells (red) and adjacent brain cells (green) in a control (J) and a sly mutant (L). The time is colour-coded: light colours at the beginning of the trajectory (22 hpf) towards dark colours for the end of the track (1080 min later). Only the left side of the embryo is shown. (M, N) 3D MSD analysis of OP (M) and brain cells (N) in sly mutants and control siblings (n=4 controls and n=3 mutants from five independent experiments, 10–14 cells analysed in each tissue). (O) Rose plots indicating the orientation of the movement for control and mutant left OP cells (data pooled from n=4 controls and n=3 mutants from five independent experiments). Numbers = number of cells. Dorsal to the top, lateral to the left. There is a statistical difference in cell track orientations between controls and mutants (circular analysis of variance based on the likelihood ratio test: p=1.233e-09 for the left OPs, and p=3.439e-08 for the right OPs, the graphs for the rigth OPs are not shown).