
- Title
-
Gallbladder-derived retinoic acid signalling drives reconstruction of the damaged intrahepatic biliary ducts
- Authors
- He, J., Li, S., Yang, Z., Ma, J., Qian, C., Huang, Z., Li, L., Yang, Y., Chen, J., Sun, Y., Zhao, T., Luo, L.
- Source
- Full text @ Nat. Cell Biol.
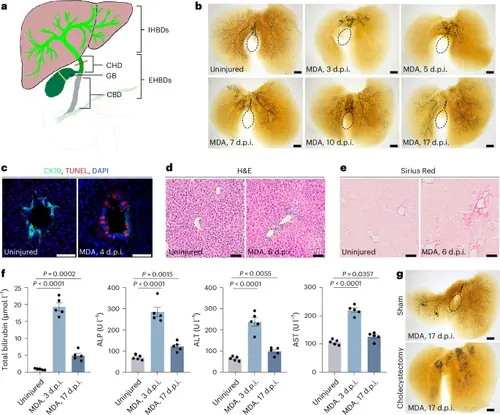
Reconstruction of a severely damaged IHBD network requires gallbladder in mouse.a, Diagram showing the IHBD and EHBD systems, including CHD, gallbladder (GB) and CBD. b, The IHBD system, visualized by retrograde ink injection into the CBD of uninjured (mice, n = 10/10 mice) and MDA-treated mice at 3 d.p.i. (mice, n = 12/15 mice), 5 d.p.i. (mice, n = 11/14 mice), 7 d.p.i. (mice, n = 11/14 mice), 10 d.p.i. (mice, n = 10/14 mice) and 17 d.p.i. (n = 10/13 mice). Dashed lines outline the gallbladder. c, Immunofluorescence for CK19 and TUNEL of uninjured (n = 5) and MDA-treated (n = 5) mice at 4 d.p.i. d,e, H&E (d) and Sirius Red staining (e) of uninjured (n = 5) and MDA-treated (n = 5) mice at 6 d.p.i. f, Serum total bilirubin, alkaline phosphatase (ALP), alanine aminotransferase (ALT) and aspartate transaminase (AST) levels in uninjured (n = 5 mice) and MDA-treated mice at 3 d.p.i. (n = 5 mice) and 17 d.p.i. (n = 5 mice). g, The IHBD system visualized by retrograde ink injection into the CBD of MDA-treated mice at 17 d.p.i. in sham (n = 10/14) and cholecystectomy (n = 11/15) groups. Dashed lines outline the gallbladder. Data are presented as mean ± s.e.m.; unpaired t-test. Scale bars, 200 μm (b,g) and 50 μm (c–e). |
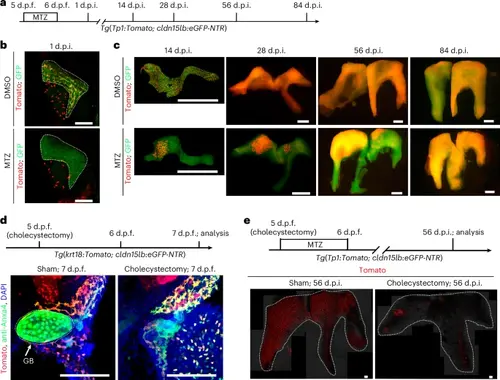
Reconstruction of the IHBD network and involvement of gallbladder are conserved in zebrafish.a, Experimental strategies for IHBD ablation and reconstruction in zebrafish. b, Confocal projection images of the Tomato+GFP+ IHBD system at 1 d.p.i. (DMSO, n = 17/17; MTZ, n = 22/22) in zebrafish larvae. c, Confocal projection images of IHBD network reconstruction in DMSO- and MTZ-treated groups at 14 d.p.i. (DMSO, n = 10/10; MTZ, n = 17/25), 28 d.p.i. (DMSO, n = 10/10; MTZ, n = 18/26), 56 d.p.i. (DMSO, n = 10/10; MTZ, n = 15/20) and 84 d.p.i. (DMSO, n = 10/10; MTZ, n = 10/13) in zebrafish. d, Experimental strategies of cholecystectomy in zebrafish and confocal projections images of gallbladder and biliary trees at 7 d.p.f. The dashed line outlines the gallbladder. e, Experimental strategies of cholecystectomy and IHBD ablation in zebrafish and confocal projection images of Tomato+ IHBD network reconstruction at 56 d.p.i. in sham (n = 41/52) and cholecystectomy (n = 33/45) groups. The dashed lines outline the liver. Scale bars, 100 μm (b,d,e) and 1 mm (c). |
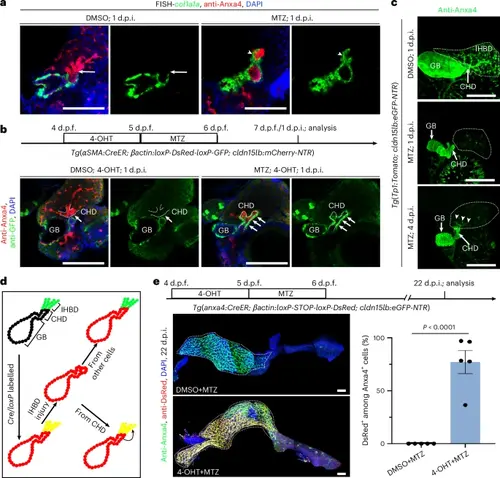
IHBD damage induces migration of the gallbladder smooth muscle to coat the CHD and subsequent ingrowth of the CHD into the inner liver in zebrafish.a, FISH combined with antibody staining images of col1a1a and Anxa4 at 1 d.p.i. The CHD was enwrapped by col1a1a+ muscle cells within 1 d.p.i. in response to IHBD damage (n = 13/13; arrowhead) compared to the DMSO group (n = 10/10; arrow). b, Experimental strategies for lineage tracing of SMCs, and antibody staining images of GFP and Anxa4 at 1 d.p.i. in DMSO-treated (n = 5/5) and MTZ-treated (n = 8/10) groups with 4-OHT incubation. c, Confocal projection and antibody staining images of Anxa4+ biliary trees in DMSO-treated (n = 8/8) and MTZ-treated zebrafish at 1 d.p.i. (n = 14/14) and 4 d.p.i. (n = 12/16). Note that newly regenerating IHBD cells start from the CHD at the early regeneration stage. d, Experimental strategies for lineage tracing of new regenerating IHBD cells. e, Top: experimental strategies for lineage tracing. Left: confocal projection and antibody staining images of Anxa4 and DsRed in DMSO- and 4-OHT-treated zebrafish at 22 d.p.i. Right: quantification of the ratio of DsRed+ among Anxa4+ IHBD cells in DMSO-treated (n = 5 zebrafish) and 4-OHT-treated (n = 5 zebrafish) zebrafish. Data are presented as mean ± s.e.m.; unpaired t-test. Scale bars, 100 μm. |
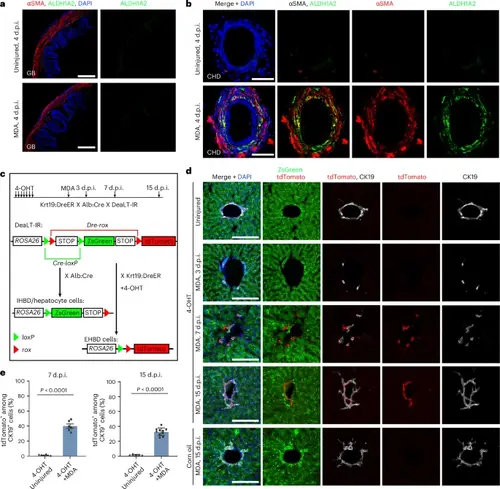
Smooth muscle migration and CHD ingrowth occur after severe IHBD damage in mouse.a, αSMA and ALDH1A2 immunofluorescent confocal images of gallbladder at 4 d.p.i. in MDA-treated (n = 7/7) and uninjured (n = 7/7) mice. b, αSMA and ALDH1A2 immunofluorescent confocal images of the CHD at 4 d.p.i. in MDA-treated (n = 5/7) and uninjured (n = 5/5) mice. Note that the CHD cells are coated with αSMA and ALDH1A2 double-positive cells after MDA treatment. c, Experimental strategies for lineage tracing of EHBD and IHBD cells with Cre/loxP-DreER/rox systems. In Krt19:DreER × Alb:Cre × DeaTL-IR triple transgenic mice, EHBD cells are marked with tdTomato after 4-OHT treatment, and IHBD cells and hepatocytes are marked with ZsGreen with or without 4-OHT treatment. d, CK19, tdTomato and ZsGreen immunofluorescent confocal images of the IHBD in 4-OHT-treated only, 4-OHT- plus MDA-treated and corn oil- plus MDA-treated mice. e, Quantification of the ratio of tdTomato+ among CK19+ cells in 4-OHT-treated only and 4-OHT plus MDA-treated mice at 7 d.p.i. (n = 6 mice) and 15 d.p.i. (4-OHT plus uninjured, n = 5 mice; 4-OHT plus MDA, n = 10 mice). Data are presented as mean ± s.e.m.; unpaired t-test. Scale bars, 100 μm (a) and 50 μm (b,d). |
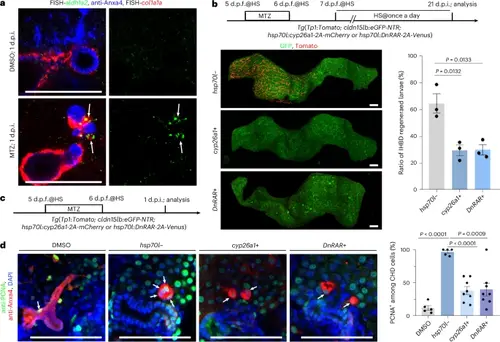
CHD-coating smooth muscles produce RA to activate CHD proliferation and ingrowth in zebrafish.a, FISH combined with antibody staining images of aldh1a2, col1a1a and Anxa4 at 1 d.p.i. in zebrafish. Note that col1a1a+ SMCs migrate from the gallbladder to the CHD and activate aldh1a2 expression (arrows) in the MTZ-treated group (n = 12/15) compared to naked CHD in the DMSO-treated group (n = 10/10). b, Top: experimental strategies to inhibit RA signalling during the reconstruction of damaged IHBD with cyp26a1 and DnRAR overexpression by heat shock (HS; abbreviated as cyp26a1+ and DnRAR+). Left: confocal projection images are shown of Tomato+ IHBD cells in cyp26a1 (n = 34/48) and DnRAR (n = 32/46) overexpression and control (n = 31/49) groups at 21 d.p.i. in zebrafish. Right: quantification of the ratio of IHBD regenerated larvae (n = 3 groups). c, Experimental strategies to inhibit RA signalling with heat shock during IHBD damage in zebrafish. d, Left: antibody staining confocal images for PCNA and Anxa4 at 1 d.p.i. Right: quantification of the ratio of PCNA+ cells in the CHD in DMSO (n = 5 larvae), hsp70l− (n = 5 larvae), cyp26a1+ (n = 8 larvae) and DnRAR+ (n = 8 larvae) zebrafish groups. Arrows indicate the PCNA+ CHD cells. Data are presented as mean ± s.e.m.; unpaired t-test. Scale bars, 100 μm |
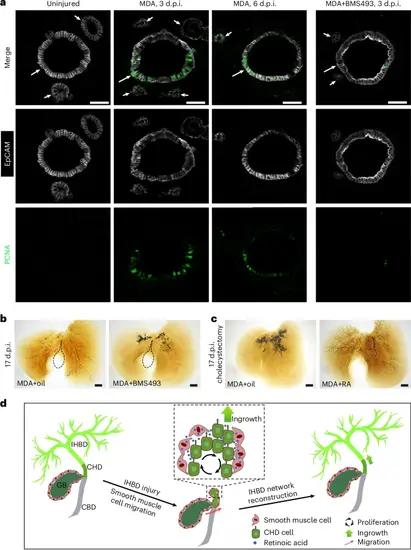
The roles of the RA signal in CHD cell proliferation and IHBD network reconstruction are conserved in mouse.a, EpCAM and PCNA immunohistochemistry on sections of the CHD from uninjured mice (n = 5/5), MDA-injured mice at 3 d.p.i. (n = 4/5) and 6 d.p.i. (n = 4/5), and MDA-injured mice after BMS493 treatment at 3 d.p.i. (n = 4/6). Arrows and arrowheads indicate CHD and peribiliary glands, respectively. b,c, The IHBD system visualized by retrograde ink injection into the CBD after MDA treatment with oil (n = 9/13) and BMS493 (n = 10/12) (b) and with cholecystectomy plus MDA treatment with oil (n = 11/15) and RA (n = 11/14) (c) at 17 d.p.i. Dashed lines outline the gallbladder. d, Diagram summarizing the role of the gallbladder in reconstruction of the IHBD network after severe damage. In this process, gallbladder-derived smooth muscles coated with CHD produce RA to activate the proliferation and ingrowth of CHD cells into the inner liver, thereby reconstructing the IHBD system. Scale bars, 50 μm (a) and 200 μm (b,c). |