
|
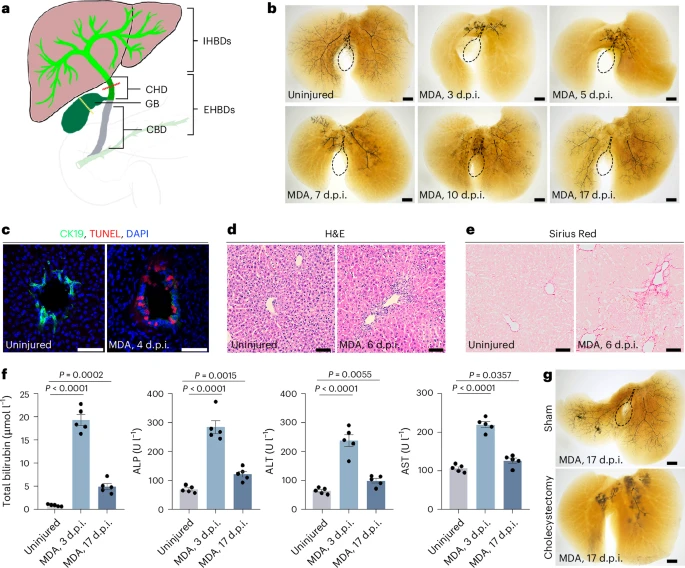
Fig. 1 Reconstruction of a severely damaged IHBD network requires gallbladder in mouse.a, Diagram showing the IHBD and EHBD systems, including CHD, gallbladder (GB) and CBD. b, The IHBD system, visualized by retrograde ink injection into the CBD of uninjured (mice, n = 10/10 mice) and MDA-treated mice at 3 d.p.i. (mice, n = 12/15 mice), 5 d.p.i. (mice, n = 11/14 mice), 7 d.p.i. (mice, n = 11/14 mice), 10 d.p.i. (mice, n = 10/14 mice) and 17 d.p.i. (n = 10/13 mice). Dashed lines outline the gallbladder. c, Immunofluorescence for CK19 and TUNEL of uninjured (n = 5) and MDA-treated (n = 5) mice at 4 d.p.i. d,e, H&E (d) and Sirius Red staining (e) of uninjured (n = 5) and MDA-treated (n = 5) mice at 6 d.p.i. f, Serum total bilirubin, alkaline phosphatase (ALP), alanine aminotransferase (ALT) and aspartate transaminase (AST) levels in uninjured (n = 5 mice) and MDA-treated mice at 3 d.p.i. (n = 5 mice) and 17 d.p.i. (n = 5 mice). g, The IHBD system visualized by retrograde ink injection into the CBD of MDA-treated mice at 17 d.p.i. in sham (n = 10/14) and cholecystectomy (n = 11/15) groups. Dashed lines outline the gallbladder. Data are presented as mean ± s.e.m.; unpaired t-test. Scale bars, 200 μm (b,g) and 50 μm (c–e).