
|
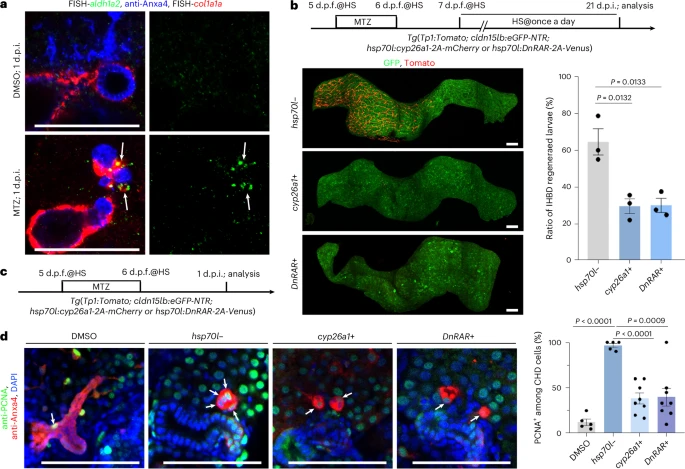
Fig. 5 CHD-coating smooth muscles produce RA to activate CHD proliferation and ingrowth in zebrafish.a, FISH combined with antibody staining images of aldh1a2, col1a1a and Anxa4 at 1 d.p.i. in zebrafish. Note that col1a1a+ SMCs migrate from the gallbladder to the CHD and activate aldh1a2 expression (arrows) in the MTZ-treated group (n = 12/15) compared to naked CHD in the DMSO-treated group (n = 10/10). b, Top: experimental strategies to inhibit RA signalling during the reconstruction of damaged IHBD with cyp26a1 and DnRAR overexpression by heat shock (HS; abbreviated as cyp26a1+ and DnRAR+). Left: confocal projection images are shown of Tomato+ IHBD cells in cyp26a1 (n = 34/48) and DnRAR (n = 32/46) overexpression and control (n = 31/49) groups at 21 d.p.i. in zebrafish. Right: quantification of the ratio of IHBD regenerated larvae (n = 3 groups). c, Experimental strategies to inhibit RA signalling with heat shock during IHBD damage in zebrafish. d, Left: antibody staining confocal images for PCNA and Anxa4 at 1 d.p.i. Right: quantification of the ratio of PCNA+ cells in the CHD in DMSO (n = 5 larvae), hsp70l− (n = 5 larvae), cyp26a1+ (n = 8 larvae) and DnRAR+ (n = 8 larvae) zebrafish groups. Arrows indicate the PCNA+ CHD cells. Data are presented as mean ± s.e.m.; unpaired t-test. Scale bars, 100 μm