
|
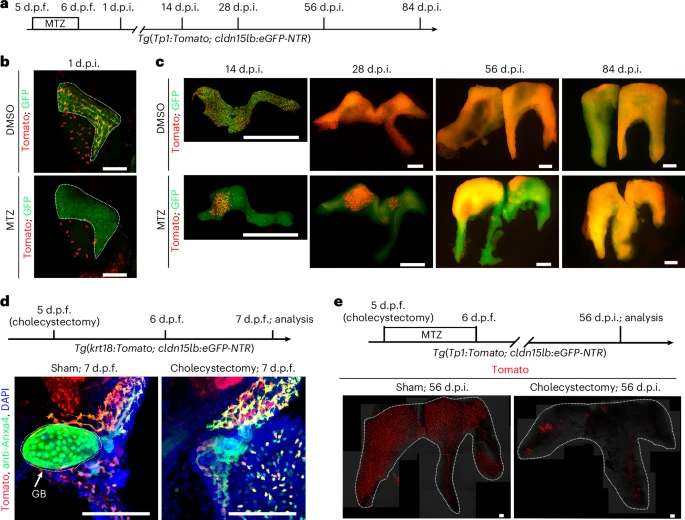
Fig. 2 Reconstruction of the IHBD network and involvement of gallbladder are conserved in zebrafish.a, Experimental strategies for IHBD ablation and reconstruction in zebrafish. b, Confocal projection images of the Tomato+GFP+ IHBD system at 1 d.p.i. (DMSO, n = 17/17; MTZ, n = 22/22) in zebrafish larvae. c, Confocal projection images of IHBD network reconstruction in DMSO- and MTZ-treated groups at 14 d.p.i. (DMSO, n = 10/10; MTZ, n = 17/25), 28 d.p.i. (DMSO, n = 10/10; MTZ, n = 18/26), 56 d.p.i. (DMSO, n = 10/10; MTZ, n = 15/20) and 84 d.p.i. (DMSO, n = 10/10; MTZ, n = 10/13) in zebrafish. d, Experimental strategies of cholecystectomy in zebrafish and confocal projections images of gallbladder and biliary trees at 7 d.p.f. The dashed line outlines the gallbladder. e, Experimental strategies of cholecystectomy and IHBD ablation in zebrafish and confocal projection images of Tomato+ IHBD network reconstruction at 56 d.p.i. in sham (n = 41/52) and cholecystectomy (n = 33/45) groups. The dashed lines outline the liver. Scale bars, 100 μm (b,d,e) and 1 mm (c).