
- Title
-
Loss of Brcc3 in Zebrafish Embryos Increases Their Susceptibility to DNA Damage Stress
- Authors
- Wang, Z., Wang, C., Zhai, Y., Bai, Y., Wang, H., Rong, X.
- Source
- Full text @ Int. J. Mol. Sci.
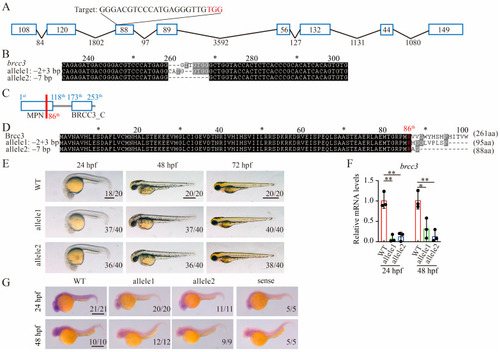
Generation of |
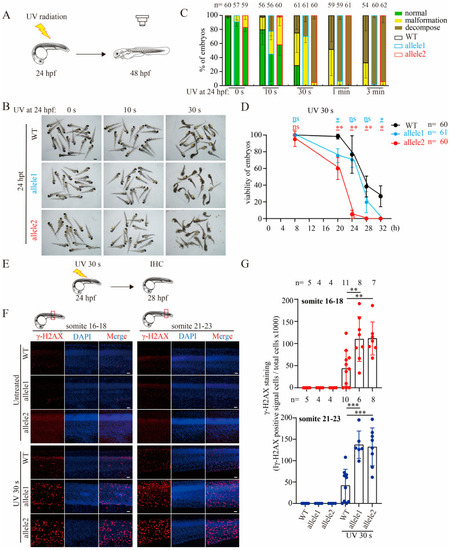
Depletion of Brcc3 in zebrafish embryos alleviates the resistance to UV radiation and increases the sensitivity to UV radiation-induced DNA damage. ( |
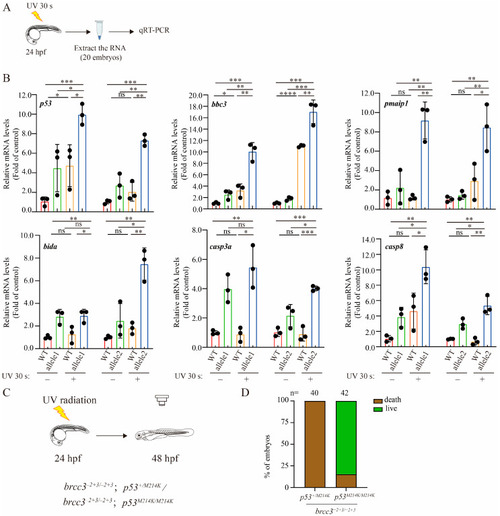
Depletion of Brcc3 in zebrafish embryos amplifies the up-regulatory response of p53 signaling to UV radiation. ( |
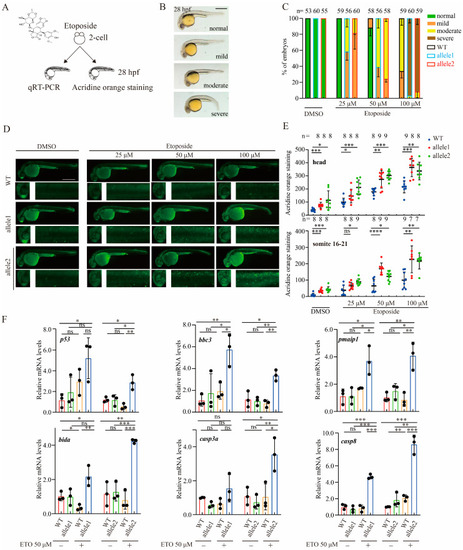
Brcc3-depleted zebrafish embryos exhibit increased sensitivity to ETO treatment. ( |
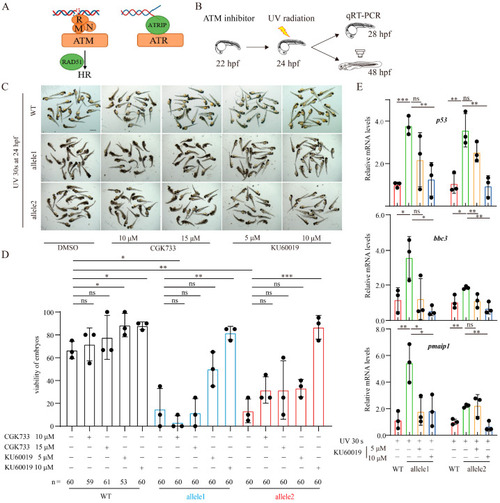
Pharmacological inhibition of ATM activation mitigates the enhanced UV radiation-induced effects after Brcc3 depletion. ( |
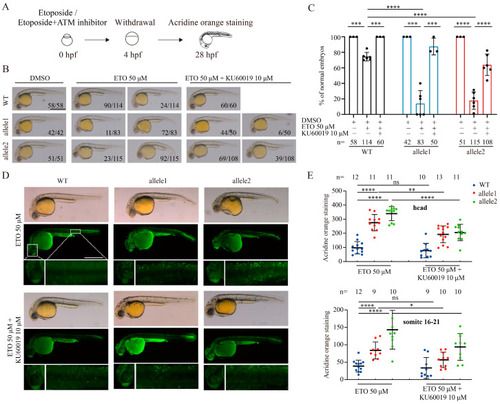
Pharmacological inhibition of ATM activation counteracts the elevated ETO-induced effects in |