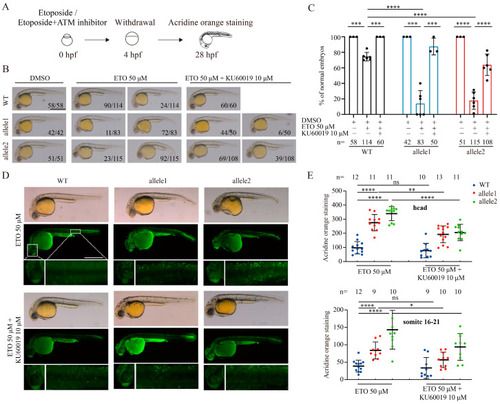
Pharmacological inhibition of ATM activation counteracts the elevated ETO-induced effects in brcc3 mutant embryos. (A) Schematic diagram of WT and brcc3 mutant embryos treated with ETO or ETO plus an ATM inhibitor. (B) Addition of an ATM inhibitor KU60019 rescued the phenotypic abnormalities caused by ETO treatment. The proportion of embryos with the indicated phenotypes is shown in the bottom right corner of each panel. Scale bar = 500 μm. (C) Quantitative results of embryos with morphological normal as shown in (B). The total number of embryos is shown below the column. Values are represented as means ± s.d. *** p < 0.001; **** p < 0.0001 (one-way ANOVA followed by Tukey’s post hoc test). (D) Acridine orange staining of WT and brcc3 mutant embryos at 28 hpf after ETO or ETO plus KU60019 treatment. White boxes indicate local magnification. Scale bar = 500 μm. (E) Quantitative results from images of head or 16–21 somite regions as shown in (D). The total number of embryos is shown above the column. Results are from three independent replicates. Values are represented as means ± s.d. ns, not significant; * p < 0.05; ** p < 0.01; **** p < 0.0001 (one-way ANOVA followed by Tukey’s post hoc test).
|
