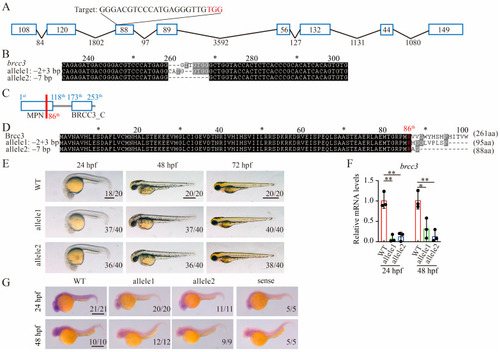
Generation of brcc3 knockout zebrafish by using CRISPR/Cas9. (A) Schematic diagram of zebrafish brcc3 gene and CRISPR/Cas9 target site. The blue box represents the exon, and the black line represents the intron. CRISPR/Cas9 gRNA target site locates in the third exon and the target sequence is indicated at the top of the image. Protospacer adjacent motif (PAM) region is shown in red. (B) The generated zebrafish brcc3-null alleles. (C) Schematic diagram of zebrafish Brcc3 domains. The red line indicates the initial abnormal translation site of the mutant brcc3 alleles. (D) The predicted protein sequences of WT and mutant brcc3 alleles are shown. (E) Representative images of WT, MZbrcc3−2+3/−2+3, and MZbrcc3−7/−7 mutant embryos at 24, 48, and 72 hpf. Lateral views with anterior to the left. Scale bar = 500 μm. (F) The relative mRNA levels of brcc3 in WT and mutant embryos at 24 and 48 hpf, as indicated by qRT-PCR analysis. The results are from three independent replicates. Values are represented as means ± s.d. * p < 0.05; ** p < 0.01 (unpaired two-tailed Student’s t-test). (G) Expression of brcc3 in WT and brcc3 mutant embryos at 24 and 48 hpf. The sense probe of brcc3 was used as a control. Scale bar = 500 μm. The proportion of embryos with the indicated phenotypes is shown in the bottom right corner of each panel.
|
