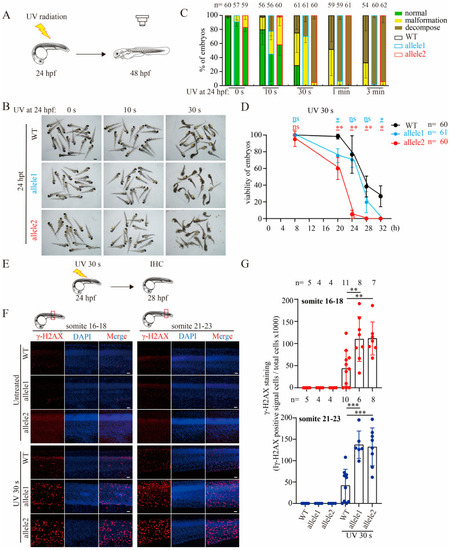
Depletion of Brcc3 in zebrafish embryos alleviates the resistance to UV radiation and increases the sensitivity to UV radiation-induced DNA damage. (A) Schematic diagram of zebrafish embryos radiated with UV. Embryos were radiated for different times of duration at 24 hpf and then raised to 48 hpf. (B) Representative images of WT and mutant embryos at 48 hpf after UV radiation. WT and mutant embryos at 24 hpf were treated with UV for 0 s, 10 s, and 30 s, and then raised to 48 hpf. hpt, hours-post treatment; Scale bar = 1 mm. (C) Quantitative results from images as shown in (B). WT and mutant embryos at 48 hpf in B were categorized into normal, malformed, and decomposed classes, respectively. Results are from three independent replicates. The total number of embryos in each group is shown above the column. (D) Survival curve of WT and mutant embryos after 30 s UV radiation. WT and mutant embryos at 24 hpf were treated with UV for 30 s and viability was continuously recorded at the indicated timepoint from 8 to 32 h after treatment. The total number of embryos in each group is shown in the upper right corner of the column. Values are represented as means ± s.d. ns, not significant; * p < 0.05; ** p < 0.01 (unpaired two-tailed Student’s t-test). (E) Schematic diagram of UV radiation experiments for immunohistochemical staining analysis. (F) Representative confocal images of WT and brcc3 mutant embryos at 28 hpf which were immunostained with an anti-γ-H2AX antibody after UV radiation. Nuclei were counterstained with DAPI (blue). Somite 16 to 18 and 21 to 23 were selected for confocal imaging analysis, respectively. Scale bar = 10 μm. (G) Quantitative results from images as shown in (F). The γ-H2AX signal was represented by the γ-H2AX positive signal cells/total cells × 1000. Results are from three independent replicates. Values are represented as means ± s.d. ** p < 0.01; *** p < 0.001 (one-way ANOVA followed by Tukey’s post hoc test).
|
