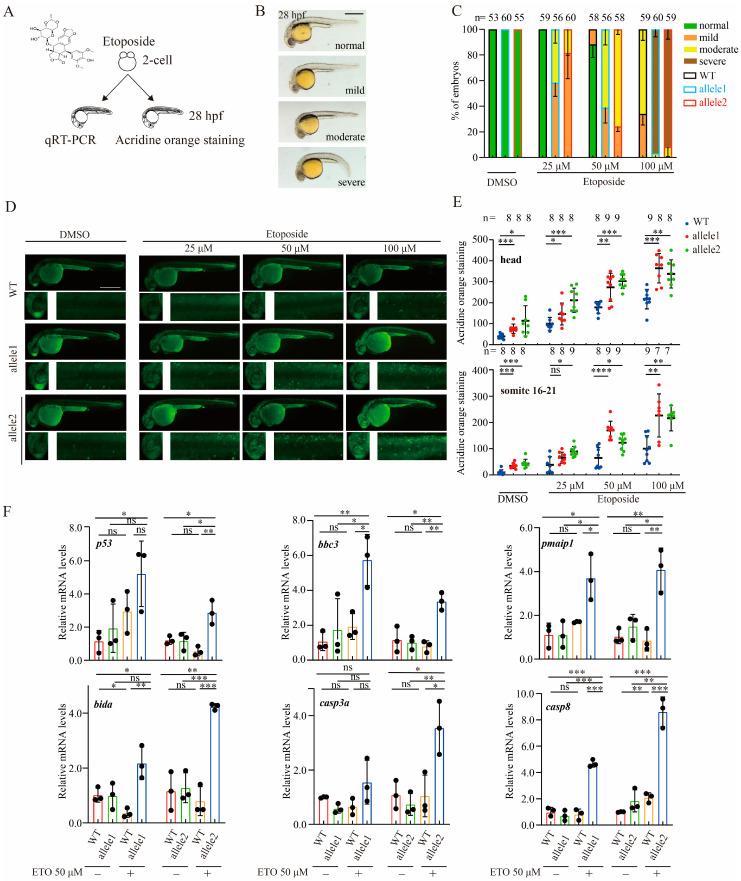
Brcc3-depleted zebrafish embryos exhibit increased sensitivity to ETO treatment. (A) Schematic diagram of ETO treatment of WT and brcc3 mutant embryos for immunohistochemical staining and qRT-PCR analysis. (B) The various degrees of apoptosis of embryos after treatment with ETO. Scale bar = 500 μm. (C) Quantitative results from images as shown in (B). WT and brcc3 mutant embryos at 28 hpf in (B) were categorized into each indicated group. Results are from three independent replicates. Values are represented as means ± s.d. The total number of embryos is shown at the top of each column. (D) Acridine orange staining of WT and brcc3 mutant embryos at 28 hpf after ETO treatment with various doses. Scale bar = 500 μm. (E) Quantitative results from images of head (upper panel) or 16–21 somite (lower panel) region as shown in (D). The total number of embryos is shown on each column. Values are represented as means ± s.d. ns, not significant; * p < 0.05; ** p < 0.01; *** p < 0.001; **** p < 0.0001 (one-way ANOVA followed by Tukey’s post hoc test). (F) The relative mRNA levels of p53 and indicated genes in WT and brcc3 mutant embryos at 48 hpf with/without ETO treatment. Results are from three independent replicates. Values are represented as means ± s.d. ns, not significant; * p < 0.05; ** p < 0.01; *** p < 0.001 (one-way ANOVA followed by Tukey’s post hoc test).
Acknowledgments
This image is the copyrighted work of the attributed author or publisher, and
ZFIN has permission only to display this image to its users.
Additional permissions should be obtained from the applicable author or publisher of the image.
Full text @ Int. J. Mol. Sci.
Your Input Welcome
Thank you for submitting comments. Your input has been emailed to ZFIN curators who may contact you if
additional information is required.
Oops. Something went wrong. Please try again later.