
- Title
-
Elucidating tobacco smoke-induced craniofacial deformities: Biomarker and MAPK signaling dysregulation unraveled by cross-species multi-omics analysis
- Authors
- Lin, Y., Li, H., Zheng, S., Han, R., Wu, K., Tang, S., Zhong, X., Chen, J.
- Source
- Full text @ Ecotoxicol. Environ. Saf.
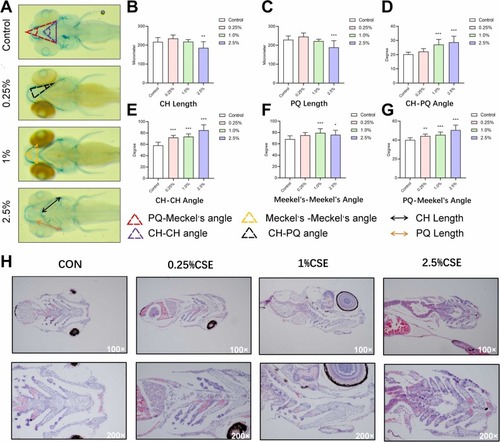
Cigarette Smoke Extract Exposure Inhibits Craniofacial Development in Zebrafish Larvae. (A) Ventral views of Alcian-stained larval craniofacial cartilage exposed to cigarette smoke extract (CSE) for 7 dpf. Bar charts present quantitative data for various metrics: (B) ceratohyal (CH) Length; (C) palatoquadrate (PQ) Length; (D) CH-PQ Angle; (E) CH-CH Angle; (F) Meckel’s-Meckel’s Angle; (G) PQ-Meckel’s Angle in response to CSE exposure. Data represent the average of 3 independent experiments (10 larvae/replicate). * p < 0.05, ** p < 0.01, *** p < 0.001. (H) Cartilage sections of zebrafish larvae exposed to CSE were also examined by Hematoxylin and Eosin (HE) staining. Scale bars represent 50 μm (lower) and 100 μm (upper). |

Craniofacial Development-Related Genes and miRNAs in Zebrafish Larvae Exposed to 2.5 % CSE. (A) Overlap between differentially expressed genes (DEGs) induced by 2.5 % CSE and genes related to craniofacial development. (B) The volcano plot of DEGs in 2.5 % CSE-exposure and control groups; highlighted genes represent the top 10 intersected craniofacial developmental DEGs with significant expression changes. (C) Protein–Protein Interaction (PPI) network constructed from intersected developmental DEGs using the edge-percolated component (EPC) method; the width and color of each edge (ranging from blue to purple) correspond to the combined score, while the size and color of each node (ranging from yellow to red) relate to the EPC score. (D) Overlap between differentially expressed microRNAs (DEMis) induced by 2.5 % CSE and target miRNAs of intersected developmental DEGs. (E) The volcano plot of DEMis in 2.5 % CSE-exposure and control groups, with highlighted intersected target DEMis. (F) Craniofacial developmental network diagram for miRNA–mRNA interactions. Purple ellipses, upregulated hub craniofacial developmental-related DEGs; red triangles, upregulated target DEMis; and blue 'V' pattern, downregulated target DEMis. (G) Expression patterns of genes and miRNAs as determined by quantitative real-time PCR assay and Illumina sequencing in the craniofacial developmental network. |
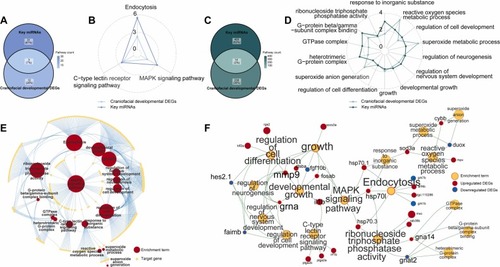
Intersected Enrichment Results at miRNA and Gene Levels in Zebrafish Larvae. (A)Overlap between KEGG enrichment results of candidate DEMis and those of intersecting craniofacial DEGs. (B) Intersected KEGG enrichment results in the Radar chart. The polar axis of the radar chart represents -log10(pvalue). (C) Overlap between GO enrichment results of candidate DEMis and those of intersecting craniofacial DEGs. (D) Intersected GO enrichment results in the Radar chart. The polar axis of the radar chart represents -log10(pvalue). (E) The enrichment term-target gene network in miRNA level. (F) The enrichment term-DEG network in gene level. |
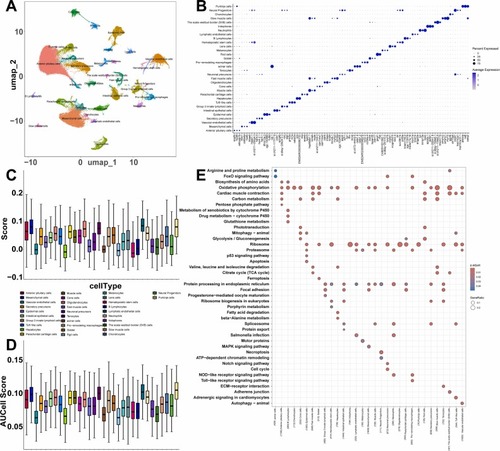
Integrated Single Cell Transcriptomics Analysis in Zebrafish Larvae. (A) A UMAP plot of 32 cell clusters from six samples (three CSE exposure and three control). (B) Cell markers identified in cell clusters. (C) The AddModuleScore assessing the active state of the MAPK signaling pathway. (D) The AUCell score assessing the active state of the MAPK signaling pathway. (E) Comparative enrichment analysis of KEGG in 32 cell clusters. |
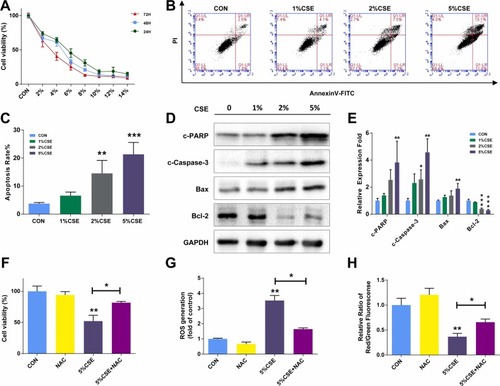
CSE Exposure Inhibits Cell Growth and Induces Apoptosis via Reactive Oxygen Species Mediates in HEPM Cells. (A) CCK-8 assay results demonstrating the viability of HEPM cells exposed to different concentrations of CSE for 24 h, 48 h, and 72 h. (B, C) Flow cytometry analysis of apoptosis in HEPM cells exposed to 1 %, 2 %, and 5 % CSE for 24 h using Annexin V-FITC/PI double staining. (D, E) Western blot assays showing the expression of apoptosis-associated proteins (cleaved-PARP, cleaved-caspase-3, bax, bcl-2) in HEPM cells exposed to 1 %, 2 %, and 5 % CSE for 24 h. Glyceraldehyde-3-Phosphate Dehydrogenase (GAPDH) served as a loading control. HEPM cells were treated with DMSO or NAC (reactive oxygen species (ROS) scavenger), along with 5 % CSE exposure. (F) Cell viability detected by CCK-8 assay. (G, H) Bar charts showed ROS and mitochondrial membrane potential quantitative data by flow cytometry. Results are presented as mean ± SD. (n=3, *p < 0.05, **p < 0.01, ***p < 0.001). |
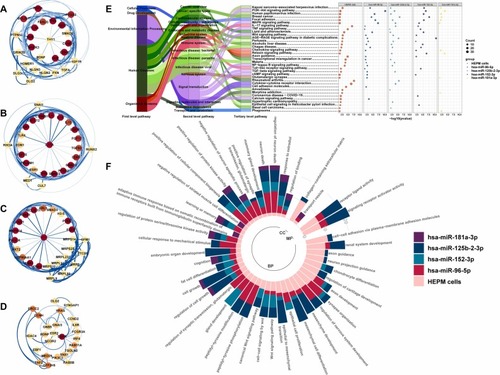
Core Functions of Candidate miRNAs in HEPM Cells Exposed to 2 % CSE. PPI networks of (A) miR-96–5p, (B) miR-125b-2–3p, (C) miR-152–3p, and (D) miR-181a-3p with the top 25 hub genes calculated using the Maximal Clique Centrality (MCC) method. The width and color of each edge (ranging from white to blue) correspond to the combined score, while the node color (ranging from yellow to red) reflects the MCC score. (E) KEGG enrichment analysis of four hub target gene groups of candidate miRNAs in humans and DEGs group induced by CSE in HEPM cells. Tertiary pathways of the KEGG findings are classified in the left Sankey diagram. (F) GO enrichment analysis of the four hub target gene groups of candidate miRNAs in humans and DEGs group induced by CSE in HEPM cells. Column length, denoted by different colors, represents the accumulation of -log10(p-value) for different group's GO terms. BP, biological process; CC, cellular component; MF, molecular function. |
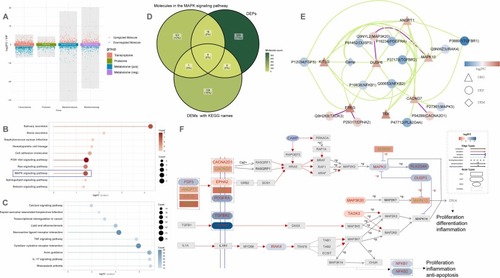
Integrated mult-omics Analysis in HEPM cells. (A)The multi-group volcano plot showing the results of differential expression analysis in transcriptomics, proteomics, and metabolomics in HEPM Cells Exposed to 2 % CSE. In transcriptomics/proteomics, y-axis = log2FC. In metabolomics, y-axis = Variable Importance in Projection (VIP). Neg, the negative ion mode; pos, the positive ion mode. KEGG enrichment analysis of upregulated DEGs (B) and downregulated DEGs (C). (D) Overlap between molecules in the MAPK signaling pathway and differential expressed proteins (DEPs) as well as metabolic (DEMs). (E) The correlation network with strongly correlated moleculars. Green line, the positive correlation; purple line, the negative correlation. (F) The pathview of the MAPK signaling pathway with marked strongly correlated moleculars. |