
Fig. 6
- ID
- ZDB-FIG-250116-30
- Publication
- Lin et al., 2024 - Elucidating tobacco smoke-induced craniofacial deformities: Biomarker and MAPK signaling dysregulation unraveled by cross-species multi-omics analysis
- Other Figures
- All Figure Page
- Back to All Figure Page
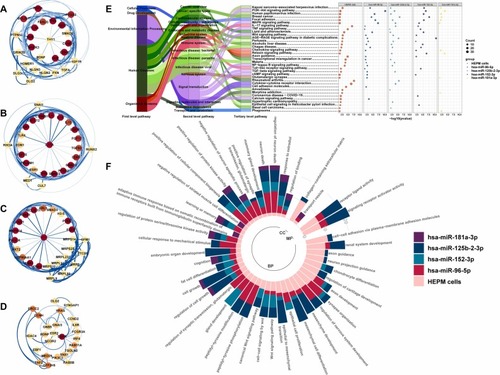
Core Functions of Candidate miRNAs in HEPM Cells Exposed to 2 % CSE. PPI networks of (A) miR-96–5p, (B) miR-125b-2–3p, (C) miR-152–3p, and (D) miR-181a-3p with the top 25 hub genes calculated using the Maximal Clique Centrality (MCC) method. The width and color of each edge (ranging from white to blue) correspond to the combined score, while the node color (ranging from yellow to red) reflects the MCC score. (E) KEGG enrichment analysis of four hub target gene groups of candidate miRNAs in humans and DEGs group induced by CSE in HEPM cells. Tertiary pathways of the KEGG findings are classified in the left Sankey diagram. (F) GO enrichment analysis of the four hub target gene groups of candidate miRNAs in humans and DEGs group induced by CSE in HEPM cells. Column length, denoted by different colors, represents the accumulation of -log10(p-value) for different group's GO terms. BP, biological process; CC, cellular component; MF, molecular function. |