
Image
|
Figure Caption
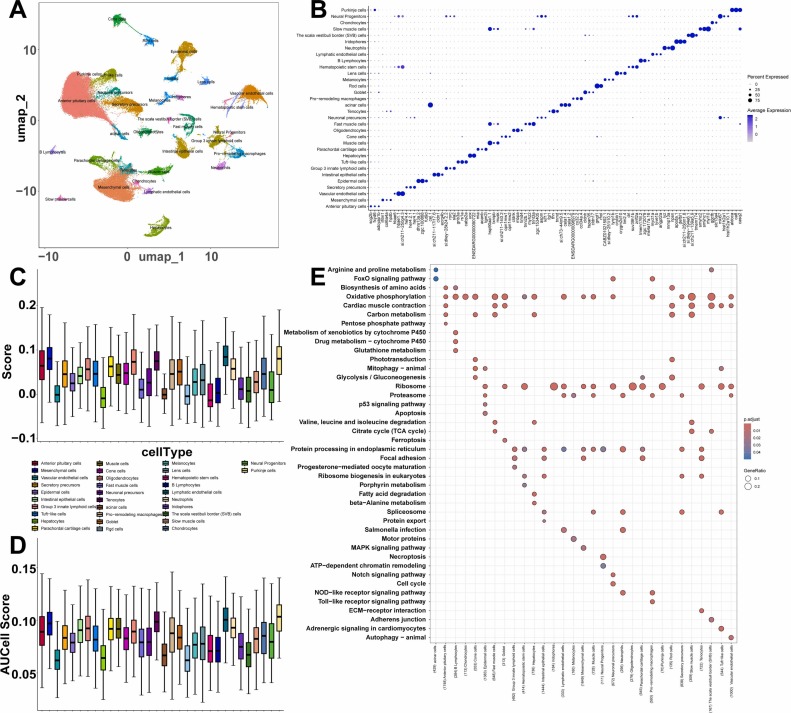
Fig. 4 Integrated Single Cell Transcriptomics Analysis in Zebrafish Larvae. (A) A UMAP plot of 32 cell clusters from six samples (three CSE exposure and three control). (B) Cell markers identified in cell clusters. (C) The AddModuleScore assessing the active state of the MAPK signaling pathway. (D) The AUCell score assessing the active state of the MAPK signaling pathway. (E) Comparative enrichment analysis of KEGG in 32 cell clusters.
Acknowledgments
This image is the copyrighted work of the attributed author or publisher, and
ZFIN has permission only to display this image to its users.
Additional permissions should be obtained from the applicable author or publisher of the image.
Full text @ Ecotoxicol. Environ. Saf.