
|
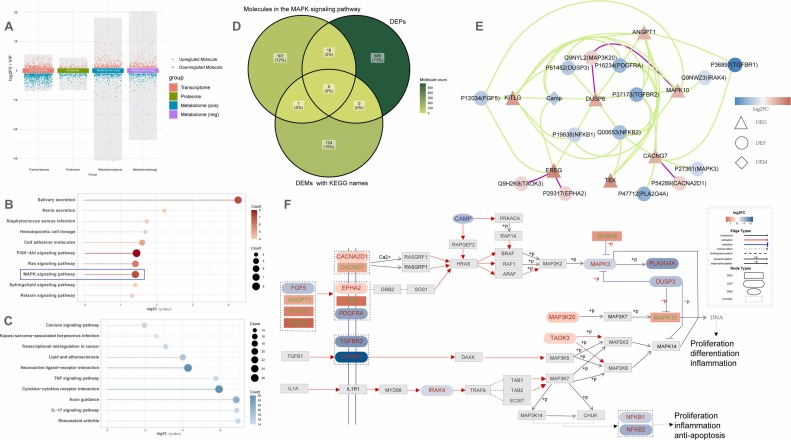
Fig. 7 Integrated mult-omics Analysis in HEPM cells. (A)The multi-group volcano plot showing the results of differential expression analysis in transcriptomics, proteomics, and metabolomics in HEPM Cells Exposed to 2 % CSE. In transcriptomics/proteomics, y-axis = log2FC. In metabolomics, y-axis = Variable Importance in Projection (VIP). Neg, the negative ion mode; pos, the positive ion mode. KEGG enrichment analysis of upregulated DEGs (B) and downregulated DEGs (C). (D) Overlap between molecules in the MAPK signaling pathway and differential expressed proteins (DEPs) as well as metabolic (DEMs). (E) The correlation network with strongly correlated moleculars. Green line, the positive correlation; purple line, the negative correlation. (F) The pathview of the MAPK signaling pathway with marked strongly correlated moleculars.