
- Title
-
R391 human dominant mutation does not affect TubB4b localization and sensory hair cells structure in zebrafish inner ear and lateral line
- Authors
- Smaili, W., Pezet, C., Marlin, S., Ernest, S.
- Source
- Full text @ Dev. Biol.

Expression pattern of tubB4b[Chr5] and tubB4b[Chr14] mRNA during WT zebrafish embryo development. Whole mount in situ hybridization with tubB4b[Chr5]-specific antisense (1st row), tubB4b[Chr14]-specific antisense (2nd row), tubB4b[Chr5]-specific sense (3rd row) and myo7aa antisense (4th row) RNA probes was performed in zebrafish larva from 20 hpf (A), 24 hpf (B), 48 hpf (C), 72 hpf (D) and 5 dpf (E). A: lateral view of whole larva (upper panel); dorsal view centered on otic vesicle (left bottom panel) and on eyes (right bottom panel). B: lateral view of whole larva (upper panel); lateral view of head (left central panel); dorsal view centered on otic vesicle (right central panel); dorsal view of tail (bottom panel). C: dorsal view of whole larva and head (2 upper panels); lateral view of whole larva and tail (2 lower panels). D: dorsal view of whole larva and head (2 upper panels); lateral view of whole larva and head (2 lower panels). E: dorsal view of whole larva (upper panel); ventral view of head (2nd to the top); lateral view of whole larva, head and tail (3 lower panels). oc: optic cup; ov: otic vesicle; arrowhead: macular sensory hair cells; e: eye; p: pronephros; oe: olfactory epithelium; cmz: ciliary marginal zone; tb: taste buds; ∗: neuromast. Scale bar = 150 μm. |

Expression pattern of tubB4b[Chr5] mRNA during zebrafish embryo development. Whole mount in situ hybridization with tubB4b[Chr5]-specific antisense RNA probe in zebrafish larva. A: 20 hpf embryo; dorsal views. B: 24 hpf embryo; lateral view (left panel) and dorsal view focused on otic vesicle (top right) and tail (bottom right). C: 48 hpf embryo; lateral view (left panel) and dorsal view (central panel) of head; lateral view (top right panel) and dorsal view (bottom right panel) of tail. D: 72 hpf larva; lateral view (left panel) and dorsal view of head (central panel) and trunk (right panel). E: 4 dpf larva; lateral views (top and bottom left panels) and dorsal views (top right, central bottom and bottom right panels). F: 5 dpf larva; lateral views (top and bottom left panels) and dorsal views (top right, central bottom and bottom right panels). Insert within upper right panel shows one neuromast at high magnification. Flat mount (A) or whole mount (B–F) images. oc: optic cup; ov: otic vesicle; arrowhead: macular sensory hair cells; cns: central nervous system; sc: spinal cord; p: pronephros; e: eye; oe: olfactory epithelium; cmz: ciliary marginal zone; pct: proximal convoluted tubule; pd: pronephric duct; ∗: neuromast. Scale bar = 150 μm for whole embryo pictures, 50 μm for head or trunk excerpt and 10 μm for neuromast inset. |
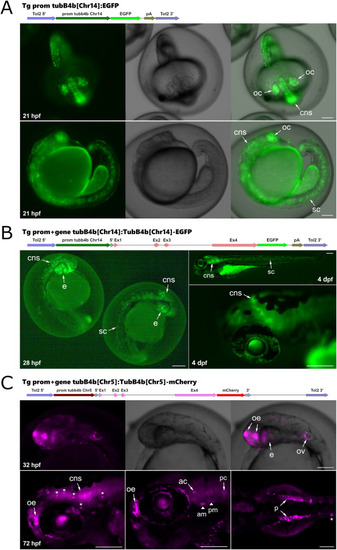
Transient expression profile of transgenesis vectors designed to identify tubB4b regulatory regions. A: fluorescence signal detected in zebrafish embryos injected with a Tol2 vector containing tubB4b[Chr14] promoter driving expression of EGFP. B: fluorescence signal detected in zebrafish embryos injected with a Tol2 vector containing tubB4b[Chr14] promoter-gene fused to EGFP. C: fluorescence signal detected in zebrafish embryos injected with a Tol2 vector containing tubB4b[Chr5] promoter-gene fused to mCherry. oc: optic cup; ov: otic vesicle; arrowhead: macular sensory hair cells (am: anterior macula; pm: posterior macula); cns: central nervous system; sc: spinal cord; p: pronephros; e: eye; oe: olfactory epithelium; ac: anterior crista; pc: posterior crista; ∗: neuromast. Scale bar = 150 μm. |
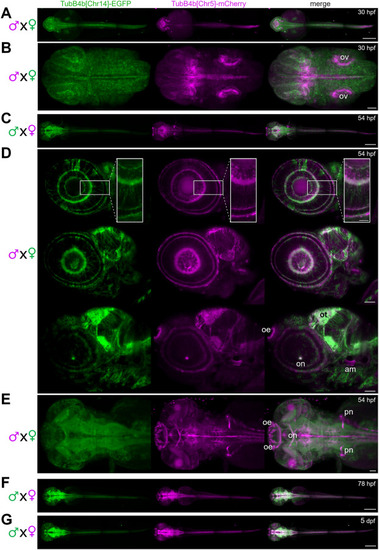
Expression of TubB4b[Chr14] and TubB4b[Chr5] in developing zebrafish larva. A,B,D,E: double transgenic larva obtained from females Tg(tubB4b[Chr14]:TubB4b[Chr14]-EGFP)+/0 crossed with males Tg(tubB4b[Chr5]:TubB4b[Chr5]-mCherry)+/0 and observed at 30 hpf (A,B) or 54 hpf (D,E). C,F,G: double transgenic larva obtained from females Tg(tubB4b[Chr5]:TubB4b[Chr5]-mCherry)+/0 crossed with males Tg(tubB4b[Chr14]:TubB4b[Chr14]-EGFP)+/0 and observed at 54 hpf (C), 78 hpf (F) or 5 dpf (G). Zeiss Lighsheet imaging of whole larva (A,C,F,G; scale bar = 300 μm) or head region (B,D,E; scale bar = 50 μm; scale bar = 20 μm for inset in D). Dorsal view (A,B,C,E,F,G) or lateral view (D). Projection of stacks in A,B,C,E,F,G; single digital sections in D, from lateral (top panel) to medial (bottom panel). ov: otic vesicle; oe: olfactory epithelium; ot: optic tectum; on: optic nerve; am: anterior macula; pn: pronephros. |

Expression of TubB4b[Chr5] in various tissues of zebrafish larva. A: Utricule (anterior macula: am) from double transgenic Tg(myo7aa:EGFP)+/0; Tg(tubB4b[Chr5]:TubB4b[Chr5]-mCherry)+/0 larva observed at 78 hpf (left panel) and anterior macula (am) from Tg(tubB4b[Chr5]:TubB4b[Chr5]-mCherry)+/0 larva imaged at 5 dpf (right panel). B: inner ear anterior half of fixed Tg(tubB4b[Chr5]:TubB4b[Chr5]-mCherry)+/0 larva displaying anterior crista (ac), lateral crista (lc) and 2 head neuromast (n). C: live imaging of lateral crista (lc) and posterior crista (pc) in a 72 hpf Tg(tubB4b[Chr5]:TubB4b[Chr5]-mCherry)+/0 larva. D: live imaging of a head neuromast (n) from a double transgenic Tg(tubB4b[Chr5]:TubB4b[Chr5]-mCherry)+/0; Tg(actb2:Mmu.Arl13b-GFP)+/0 larva. E: live imaging of olfactory epithelium (oe) in a 5 dpf Tg(tubB4b[Chr5]:TubB4b[Chr5]-mCherry)+/0 larva. F: live imaging of spinal chord (sc) and motoneurons (mn) in a 5 dpf Tg(tubB4b[Chr5]:TubB4b[Chr5]-mCherry)+/0 larva. G: live imaging of pronephros (p) in a double transgenic Tg(tubB4b[Chr5]:TubB4b[Chr5]-mCherry)+/0; Tg(actb2:Mmu.Arl13b-GFP)+/0 52 hpf larva. TubB4b[Chr5] indicates Tg(tubB4b[Chr5]:TubB4b[Chr5]-mCherry) fluorescence signal (A–G); EGFP indicates Tg(myo7aa:EGFP) fluorescence signal (A); Arl13b-EGFP indicates Tg(actb2:Mmu.Arl13b-GFP) fluorescence signal (D,G). Projection of various size images stacks. Scale bar = 10 μm for all images. |

Expression of TubB4b[Chr5]-EGFP and TubB4b(R391H)[Chr5]-EGFP in inner ear lateral cristae and lateral line neuromast of 5 dpf larva. KO tubB4b[Chr5]+/− larva (A,D), Tg(tubB4b[Chr5]:TubB4b[Chr5]-EGFP)+/0; KO tubB4b[Chr5]+/− larva (B,E) and Tg(tubB4b[Chr5]:TubB4b(R391H)[Chr5]-EGFP)+/0; KO tubB4b[Chr5]+/− larva (C,F) were imaged live by spinning microscopy. Single digital section in central area of cristae (A–C); maximum projection of image stacks from head neuromasts (D–F) with lateral (left panel) or apical (right panel) view. Scale bar = 10 μm for all images. Note that pigment cells autofluorescence can sometimes be seen around cristae or neuromast. For each set of images, top panel = green fluorescence signal (EGFP wavelength) and bottom panel = phase contrast image of the same area. |
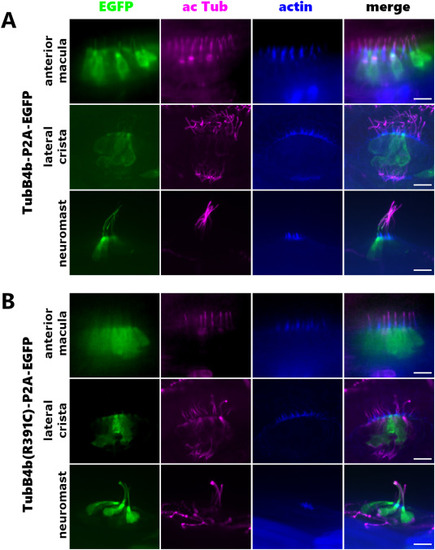
transient expression of TubB4b and TubB4b(R391C) in SHC of 5 dpf larva. Tol2 transgenesis vectors Tg(tubB4b[Chr5]:TubB4b[Chr5]-P2A-EGFP) (A) and Tg(tubB4b[Chr5]:TubB4b(R391C)[Chr5]-P2A-EGFP) (B) were injected into 1-cell stage WT eggs. Resulting 5 dpf larva were fixed and labeled for actelylated tubulin and actin and imaged by spinning disk microscopy. Cells expressing the injected constructs are visible under green fluorescent light (EGFP wavelength). For each expression vector, anterior maculae, lateral cristae and one head neuromast are shown. Scale bar = 10 μm for all images. |

Startle response of 5 dpf zebrafish larva. A: comparative response of wild-type (AB) larvae, myo7aa marty220d/ty220d homozygous (myo7aa−/−) larvae and marty220d/+/mar+/+ siblings (myo7aa+/?). B: comparative response of wild-type (AB) larvae, KO tubB4b[Chr5]+/+, KO tubB4b[Chr5]+/− and KO tubB4b[Chr5]−/− larvae. C–D: comparative response of wild-type (AB) larvae, Tg(tubB4b[Chr5]:TubB4b[Chr5]-EGFP)+/0; KO tubB4b[Chr5]+/− and Tg(tubB4b[Chr5]:TubB4b(R391H)[Chr5]-EGFP)+/0; KO tubB4b[Chr5]+/− larvae. Results from two different transgenic lines are presented for wild-type (#8 and #25) and R391H mutation (#4 and #5). Sound stimulation was performed for 100ms at 450Hz frequency with increasing intensities. Graphs represent the startle response score of larvae from various genotypes. Score values range from 0 in absence of response to 1 when one larva responded to all 12 consecutive sound stimuli at one given intensity. Number of larvae is indicated next to genotype. Statistical comparison was made between larvae of all different genotypes at each sound intensity. Only significant differences are marked as follows: ∗P < 0.01 vs wild-type AB; ∗∗P < 0.001 vs wild-type AB; §P < 0.001 vs myo7aa +/? |
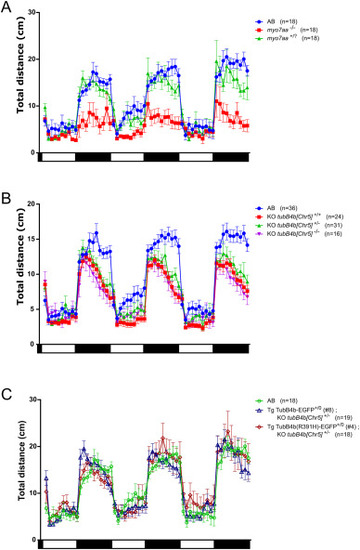
Effect of dark and light exposure on 5 dpf zebrafish locomotion. A: total swimming distance traveled by wild-type larva (AB), myo7aa marty220d/ty220d homozygous larva (myo7aa−/−) or siblings myo7aa marty220d/+ & myo7aa mar+/+ larva (myo7aa+/?); n = 3 experiments. B: total swimming distance traveled by wild-type larva (KO tubB4b[Chr5]+/+), heterozygous knock-out larva (KO tubB4b[Chr5]+/−) and homozygous knock-out larva (KO tubB4b[Chr5]−/−); n = 6 experiments. C: total swimming distance traveled by wild-type larva (AB), Tg(tubB4b[Chr5]:TubB4b[Chr5]-EGFP)+/0; KO tubB4b[Chr5]+/− larva and Tg(tubB4b[Chr5]:TubB4b(R391H)[Chr5]-EGFP)+/0; KO tubB4b[Chr5]+/− larva. n = 3 experiments. Traveled distance was measured every minute. 10 min light (white rectangle) and dark (black rectangle) periods are represented below graph. Number of larvae is indicated next to genotype. |
Reprinted from Developmental Biology, 517, Smaili, W., Pezet, C., Marlin, S., Ernest, S., R391 human dominant mutation does not affect TubB4b localization and sensory hair cells structure in zebrafish inner ear and lateral line, 301-316, Copyright (2024) with permission from Elsevier. Full text @ Dev. Biol.