FIGURE SUMMARY
Title

Canthin-6-One Inhibits Developmental and Tumour-Associated Angiogenesis in Zebrafish

Authors
Ng, M.F., Da Silva Viana, J., Tan, P.J., Britto, D.D., Choi, S.B., Kobayashi, S., Samat, N., Song, D.S.S., Ogawa, S., Parhar, I.S., Astin, J.W., Hogan, B.M., Patel, V., Okuda, K.S.
Source
Full text @ Pharmaceuticals (Basel)

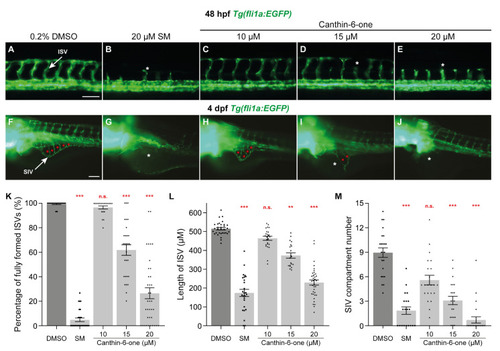
Canthin-6-one inhibits intersegmental vessel and sub-intestinal vessel development in zebrafish. (AJ) Lateral fluorescent images of 48 hpf (AE) and 4 dpf (FJ) Tg(fli1a:EGFP) embryos treated with either 0.2% DMSO (A,F), 20 µM sunitinib malate (SM, B,G), or canthin-6-one at 10 µM (C,H), 15 µM (D,I), or 20 µM (E,J). White arrows indicate the intersegmental vessel (ISV, A) or the sub-intestinal vessel (SIV, F). Red asterisks indicate the vascular compartments within the SIV (F,H,I). White asterisks indicate the reduced/absence of ISVs (B,D,E) or SIV (G,I,J). (K) Quantification of the number of fully formed ISVs in 48 hpf Tg(fli1a:EGFP) embryos treated with either 0.2% DMSO (n = 30 embryos), 20 µM SM (n = 29 embryos), or canthin-6-one at 10 µM (n = 20 embryos), 15 µM (n = 29 embryos), or 20 µM (n = 37 embryos). (L) Quantification of the length of ISVs in 48 hpf Tg(fli1a:EGFP) embryos treated with either 0.2% DMSO (n = 32 embryos), 20 µM SM (n = 26 embryos), or canthin-6-one at 10 µM (n = 25 embryos), 15 µM (n = 20 embryos), or 20 µM (n = 37 embryos). (M) Quantification of the number of SIV compartments in 4 dpf Tg(fli1a:EGFP) larvae treated with either 0.2% DMSO (n = 23 larvae), 20 µM SM (n = 20 larvae), or canthin-6-one at 10 µM (n = 22 embryos), 15 µM (n = 21 embryos), or 20 µM (n = 24 embryos). Statistical test: Kruskal-Wallis test was conducted for graphs (KM). p ≤ 0.001 (***), p ≤ 0.01 (**), p > 0.05 (not significant, n.s.). Scale bars: 100 µm.

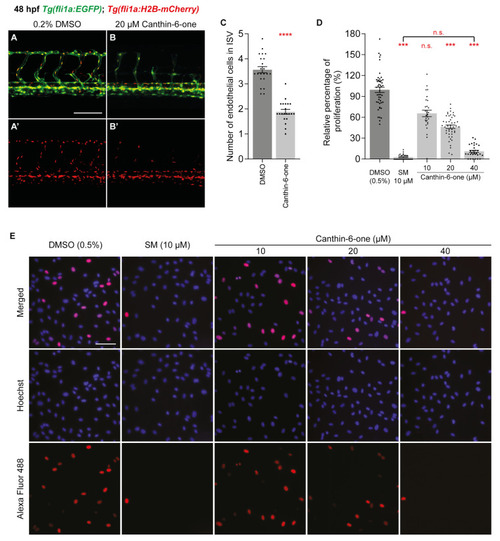
Canthin-6-one inhibits endothelial cell proliferation in zebrafish and HUVECs. (A,B’) Lateral confocal images of 48 hpf Tg(fli1a:EGFP);Tg(fli1a:H2B-mCherry) embryos treated with either 0.2% DMSO (A,A’) or 20 µM canthin-6-one (B,B’). Images (A’,B’) represent the fli1a:H2B-mCherry expression of images (A,B). (C) Quantification of intersegmental vessel (ISV) endothelial cell number in 48 hpf Tg(fli1a:EGFP);Tg(fli1a:H2B-mCherry) embryos treated with either 0.2% DMSO (n = 22 embryos) or 20 µM canthin-6-one (n = 21 embryos). Each data points represent an average of 5 ISVs from one embryo. (D) Quantification of relative percentage of proliferating HUVECs upon treatment with either 0.2% DMSO (n = 48 views), 10 µM sunitnib malate (SM, n = 30 views), or canthin-6-one at 10 µM (n = 28 views), 20 µM (n = 46 views), or 40 µM (n = 30 views). Results from at least 3 independent replicates. (E) Representative images of HUVECs treated with either 0.2% DMSO, 10 µM SM, or canthin-6-one at indicated concentrations. Cells were stained with Hoechst 33,342 (blue) and Alexa Fluor 488 (red) using the Click-iT assay. Blue indicates viable cells and red indicates proliferating cells. Statistical test: Mann-Whitney test for (C) and Kruskal-Wallis test for (D). p ≤ 0.0001 (****), p ≤ 0.001 (***), p > 0.05 (not significant, n.s.). Scale bars: 100 µm (A), 250 µm (E).

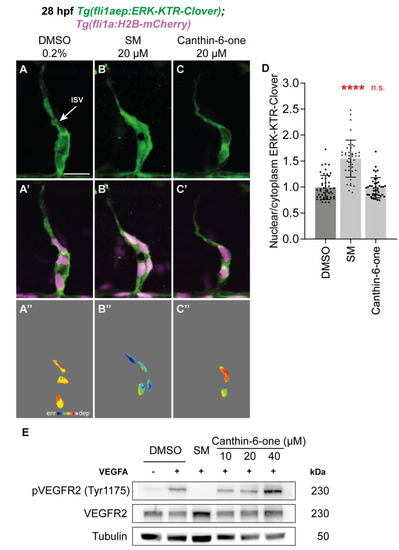
Canthin-6-one does not inhibit the VEGFA/VEGFR2 pathway. (AC’’) Lateral spinning disc confocal images of intersegmental vessel (ISV) endothelial cells in 28 hpf Tg(fli1aep:ERK-KTR-Clover);Tg(fli1a:H2B-mCherry) embryos treated with either 0.2% DMSO (A,A’,A’’), 20 µM SM (B,B’,B’’), or 20 µM canthin-6-one (C,C’,C’’). Images (AC) show fli1aep:ERK-KTR-Clover expression, while images (A’C’) show both fli1aep:ERK-KTR-Clover and fli1a:H2B-mCherry expression. Images (A’’C’’) show the nuclear fli1aep:ERK-KTR-Clover expression with intensity differences represented in 16 colour LUT (Fiji). The fli1a:H2B-mCherry signal was used to mark the nucleus. (D) Quantification of nucleus/cytoplasm ERK-KTR-Clover intensity in leading ISV endothelial cells of 28 hpf embryos treated with either 0.2% DMSO (n = 48 ISV endothelial cells from 10 embryos), 20 µM SM (n = 42 ISV endothelial cells from 10 embryos), or 20 µM canthin-6-one (n = 45 ISV endothelial cells from 12 embryos). (E) Western blot analysis of lysates isolated from HUVECs treated with either 0.2% DMSO, 10 µM sunitinib malate (SM), or canthin-6-one at indicated concentrations for 1 h and stimulated with vascular endothelial growth factor A (VEGFA) for 10 min (n = 3). Protein levels of pVEGFR2, total VEGFR2, or Tubulin were assessed. The full-length blots are presented in Figure S6. Statistical test: Kruskal-Wallis test was conducted for graph (E). p ≤ 0.0001 (****), p > 0.05 (not significant, n.s.). Scale bar: 50 µm (A).

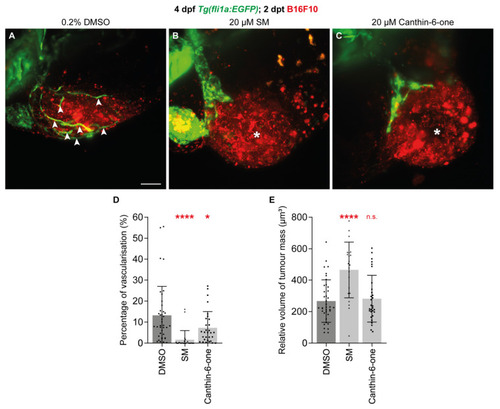
Canthin-6-one inhibits tumour-associated angiogenesis in zebrafish. (AC) Lateral light-sheet microscope images of 2 dpt (4 dpf) Tg(fli1a:EGFP) larvae injected with B16F10 melanoma cells and treated with either 0.2% DMSO (A), 20 µM sunitinib malate (SM, B), or 20 µM canthin-6-one (C) from 2 dpf. White arrow heads show tumour-associated blood vessels and asterisks indicate the absence of tumour-associated angiogenesis. (D,E) Quantification of blood vessels within the B16F10 tumour mass relative to tumour mass volume (D) or tumour mass volume (E) in 2 dpt (4 dpf) Tg(fli1a:EGFP) larvae injected with B16F10 melanoma cells and treated with either 0.2% DMSO (n = 38 larvae), 20 µM SM (n = 23 larvae), or 20 µM canthin-6-one (n = 30 larvae). Statistical test: Ordinary one-way ANOVA test was conducted for graphs (D,E). p ≤ 0.0001 (****), p ≤ 0.05 (*), p > 0.05 (not significant, n.s.). Scale bar: 100 µm (A).

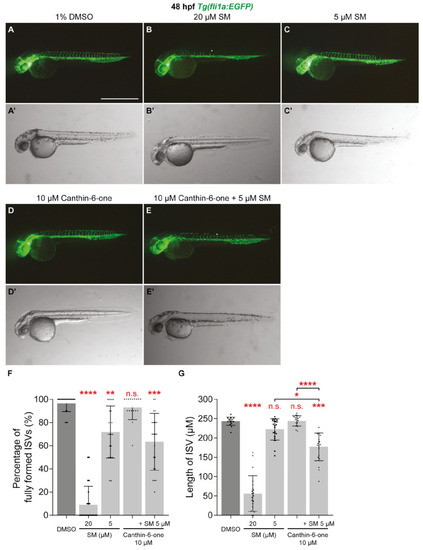
Canthin-6-one synergises with VEGFR inhibitor sunitinib malate. (AE’) Lateral fluorescent (AE) and trans-light images (AE’) of 48 hpf Tg(fli1a:EGFP) embryos treated with either 1% DMSO (A,A’), 20 µM sunitinib malate (SM, B,B’), 5 µM SM (C,C’), 10 µM canthin-6-one (D,D’), or co-treatment of 5 µM SM and 10 µM canthin-6-one (E,E’). White asterisks indicate the absence of intersegmental vessels (ISVs). (F,G) Quantification of the percentage of fully formed ISVs (F) or length of ISVs (G) in 48 hpf Tg(fli1a:EGFP) embryos treated with either 1% DMSO (n = 23), 20 µM SM (n = 22), 5 µM SM (n = 23), 10 µM canthin-6-one (n = 17), or co-treatment of 5 µM SM and 10 µM canthin-6-one (n = 21). Statistical test: Kruskal-Wallis test was conducted for graphs (F,G). p ≤ 0.0001 (****), p ≤ 0.001 (***), p ≤ 0.01 (**), p ≤ 0.05 (*), p > 0.05 (not significant, n.s.). Scale bar: 1 mm (A).

Acknowledgments
This image is the copyrighted work of the attributed author or publisher, and ZFIN has permission only to display this image to its users. Additional permissions should be obtained from the applicable author or publisher of the image. Full text @ Pharmaceuticals (Basel)