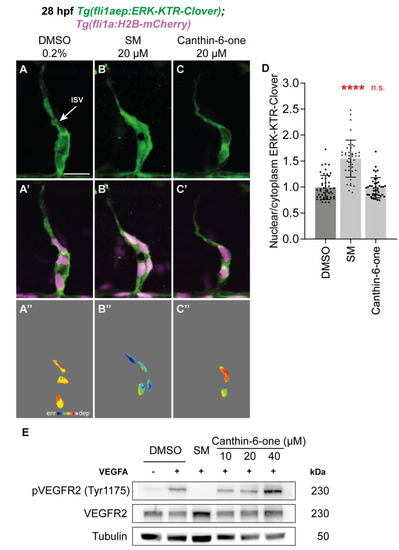
Canthin-6-one does not inhibit the VEGFA/VEGFR2 pathway. (A–C’’) Lateral spinning disc confocal images of intersegmental vessel (ISV) endothelial cells in 28 hpf Tg(fli1aep:ERK-KTR-Clover);Tg(fli1a:H2B-mCherry) embryos treated with either 0.2% DMSO (A,A’,A’’), 20 µM SM (B,B’,B’’), or 20 µM canthin-6-one (C,C’,C’’). Images (A–C) show fli1aep:ERK-KTR-Clover expression, while images (A’–C’) show both fli1aep:ERK-KTR-Clover and fli1a:H2B-mCherry expression. Images (A’’–C’’) show the nuclear fli1aep:ERK-KTR-Clover expression with intensity differences represented in 16 colour LUT (Fiji). The fli1a:H2B-mCherry signal was used to mark the nucleus. (D) Quantification of nucleus/cytoplasm ERK-KTR-Clover intensity in leading ISV endothelial cells of 28 hpf embryos treated with either 0.2% DMSO (n = 48 ISV endothelial cells from 10 embryos), 20 µM SM (n = 42 ISV endothelial cells from 10 embryos), or 20 µM canthin-6-one (n = 45 ISV endothelial cells from 12 embryos). (E) Western blot analysis of lysates isolated from HUVECs treated with either 0.2% DMSO, 10 µM sunitinib malate (SM), or canthin-6-one at indicated concentrations for 1 h and stimulated with vascular endothelial growth factor A (VEGFA) for 10 min (n = 3). Protein levels of pVEGFR2, total VEGFR2, or Tubulin were assessed. The full-length blots are presented in Figure S6. Statistical test: Kruskal-Wallis test was conducted for graph (E). p ≤ 0.0001 (****), p > 0.05 (not significant, n.s.). Scale bar: 50 µm (A).
|
