IMAGE

Figure 2

ID
ZDB-IMAGE-240129-255
Source
Figures for Ng et al., 2024
Image
Figure Caption

Figure 2

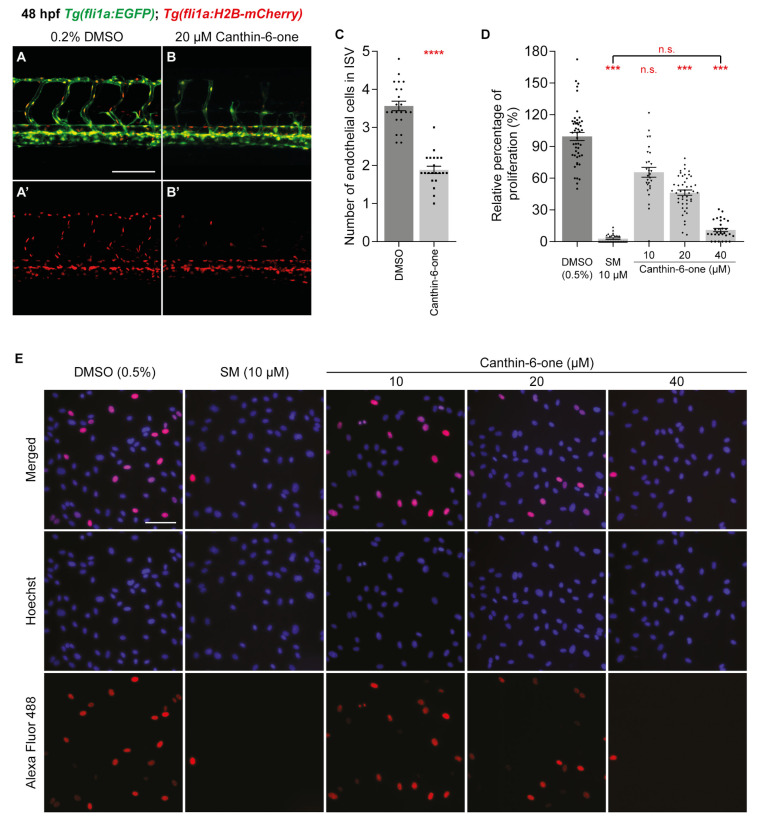
Canthin-6-one inhibits endothelial cell proliferation in zebrafish and HUVECs. (A,B’) Lateral confocal images of 48 hpf Tg(fli1a:EGFP);Tg(fli1a:H2B-mCherry) embryos treated with either 0.2% DMSO (A,A’) or 20 µM canthin-6-one (B,B’). Images (A’,B’) represent the fli1a:H2B-mCherry expression of images (A,B). (C) Quantification of intersegmental vessel (ISV) endothelial cell number in 48 hpf Tg(fli1a:EGFP);Tg(fli1a:H2B-mCherry) embryos treated with either 0.2% DMSO (n = 22 embryos) or 20 µM canthin-6-one (n = 21 embryos). Each data points represent an average of 5 ISVs from one embryo. (D) Quantification of relative percentage of proliferating HUVECs upon treatment with either 0.2% DMSO (n = 48 views), 10 µM sunitnib malate (SM, n = 30 views), or canthin-6-one at 10 µM (n = 28 views), 20 µM (n = 46 views), or 40 µM (n = 30 views). Results from at least 3 independent replicates. (E) Representative images of HUVECs treated with either 0.2% DMSO, 10 µM SM, or canthin-6-one at indicated concentrations. Cells were stained with Hoechst 33,342 (blue) and Alexa Fluor 488 (red) using the Click-iT assay. Blue indicates viable cells and red indicates proliferating cells. Statistical test: Mann-Whitney test for (C) and Kruskal-Wallis test for (D). p ≤ 0.0001 (****), p ≤ 0.001 (***), p > 0.05 (not significant, n.s.). Scale bars: 100 µm (A), 250 µm (E).

Acknowledgments
This image is the copyrighted work of the attributed author or publisher, and ZFIN has permission only to display this image to its users. Additional permissions should be obtained from the applicable author or publisher of the image. Full text @ Pharmaceuticals (Basel)