
- Title
-
A novel ERβ high throughput microscopy platform for testing endocrine disrupting chemicals
- Authors
- Abbott, D.A., Mancini, M.G., Bolt, M.J., Szafran, A.T., Neugebauer, K.A., Stossi, F., Gorelick, D.A., Mancini, M.A.
- Source
- Full text @ Heliyon
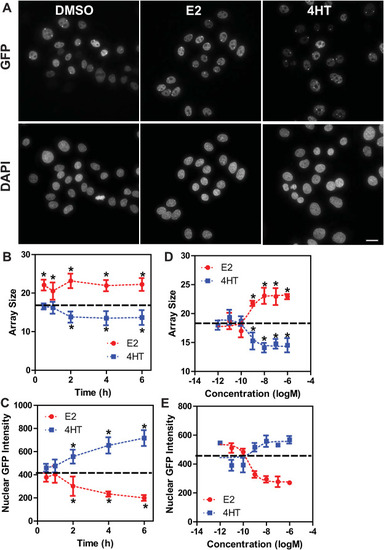
Characterization of GFP-ERβ:HeLa array cells A) Representative images of GFP-ERβ:PRL-HeLa cells taken following 2-h of the indicated treatments (DMSO, E2 100 nM, 4HT 100 nM). Images are maximum intensity projections acquired at 60x/1.42 and deconvolved. Scale bar:10 μm. B–C) array size (pixels, B) and nuclear GFP intensity (C) metrics after time course analysis of GFP-ERβ:PRL-HeLa cells treated with E2 (10 nM) and 4HT (100 nM). D-E) six-point dose response analysis at the 2-h time-point with E2 and 4HT (1pM to 1 μM) measuring array size (D) and nuclear GFP-ERβ levels (E). In panels B–E the dashed line represents the DMSO control. *p < 0.05 as compared to DMSO control. Error bars are from eight technical replicates. |
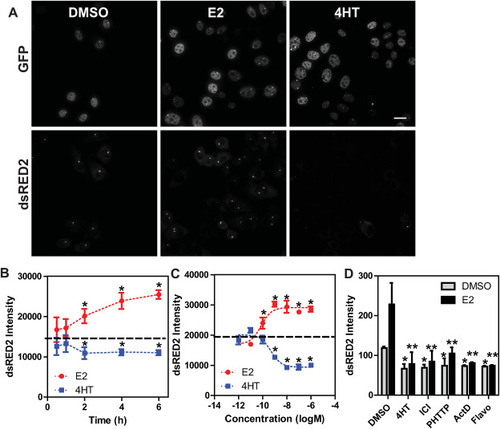
ERβ elicits a strong and reproducible transcriptional response from the PRL array (A) Representative images of dsRED2 smFISH after DMSO, E2 (10 nM), or 4HT (100 nM) treatment for 2-h; (B) quantitation of dsRED2 intensity at the PRL array after a time course treatment with E2 (10 nM) or 4HT (100 nM); C) E2 and 4HT dose-response analysis of the dsRED2 response at 2-h; and D) effect of the indicated antagonists on basal and E2 (10 nM)-stimulated dsRED2 transcription. Cells were treated with 4HT (1 μM), ICI182,780 (ICI, 1 μM), PHTTP (1 μM), actinomycin D (ActD, 1 μg/ml), and flavopiridol (Flavo, 100 nM) ± E2 10 nM *p < 0.05 as compared to DMSO control; **p < 0.05 as compared to E2 treated cells. All experiments are represented as mean and standard deviation from eight technical replicates. |
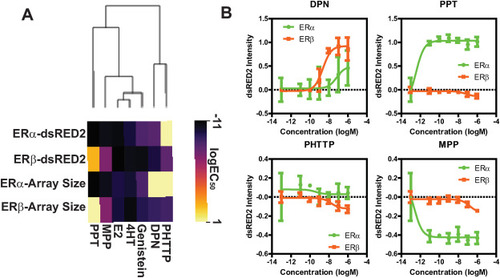
Comparison of ERα/ERβ PRL-HeLa biosensor models shows model sensitivity in differentiating ER selective compounds (A) Heatmap showing logEC50 values for GFP-ERβ:PRL-HeLa and GFP-ERα:PRL-HeLa cells treated with the indicated chemicals (10pM to 1 μM) for 2-h as measured by transcriptional reporter and chromatin remodeling features; (B) Transcriptional response (dsRED2) of ERα (red) and ERβ (green) PRL-array cells treated with multiple doses of a ERβ selective agonist (DPN), a ERβ selective antagonist (PHTTP), a ERα selective agonist (PPT), or a ERα selective antagonist (MPP). Results are shown as mean and standard deviation from 8 technical replicates. (For interpretation of the references to colour in this figure legend, the reader is referred to the Web version of this article.) |
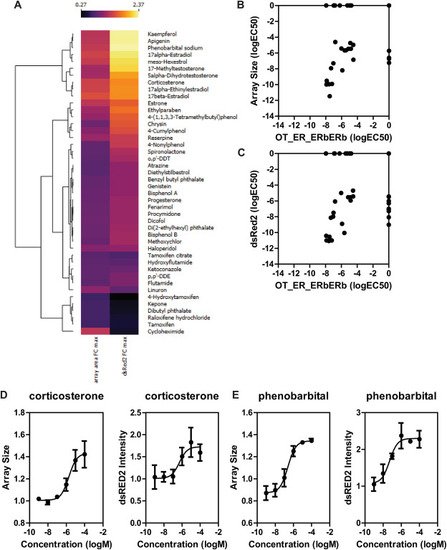
EPA45 Compound library comparison to ToxCast ERβ dimerization data A) Heatmap showing the effect of EPA45 chemicals on the GFP-ERβ:PRL-HeLa cell line represented as maximal fold change over DMSO control. Data is shown as average of three independent screens. B–C) Comparison of determined logEC50 values of GFP-ERβ:PRL-HeLa array size (B) and dsRED2 intensity (C) vs. Odyssey Thera BiFC ERβ-ERβ dimerization assay. D-E) dose-response analysis for corticosterone (D) and phenobarbital (E) using the array size and dsRed2 intensity metrics. Data is average ± standard deviation of three independent experiments. |
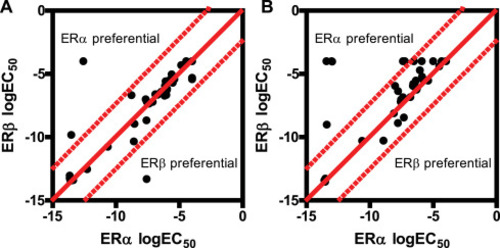
Comparison of ERs using PRL-HeLa models identifies ERβ interacting compounds in the EPA45 library of control chemicals Scatter plots comparing logEC50 values for the array size (A) or the dsRED2 transcriptional output (B) metrics in ERα and ERβ-containing cells treated for 2-h with a six-point dose-response of the EPA45 chemical library. |
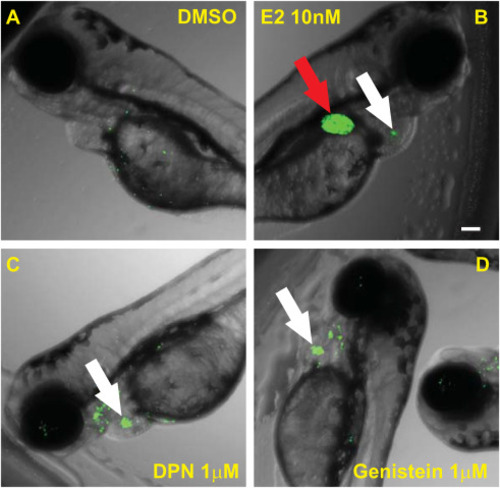
Transgenic ERE:GFP reporter zebrafish as an in vivo orthogonal assay to define ERα vs. ERβ activities Representative images of the ERE:GFP Zebrafish at 3dfp treated with: (A) DMSO; (B); 10 nM E2; (C) 1 μM DPN; and, D) 1 μM genistein. Red arrows highlight GFP signal in the liver while white arrows indicate the heart valve. Whole-well images were captured at 4x/0.16. Scale bar is 100 μm. A minimum of ten Zebrafish per treatment were assayed. (For interpretation of the references to colour in this figure legend, the reader is referred to the Web version of this article.) |