
|
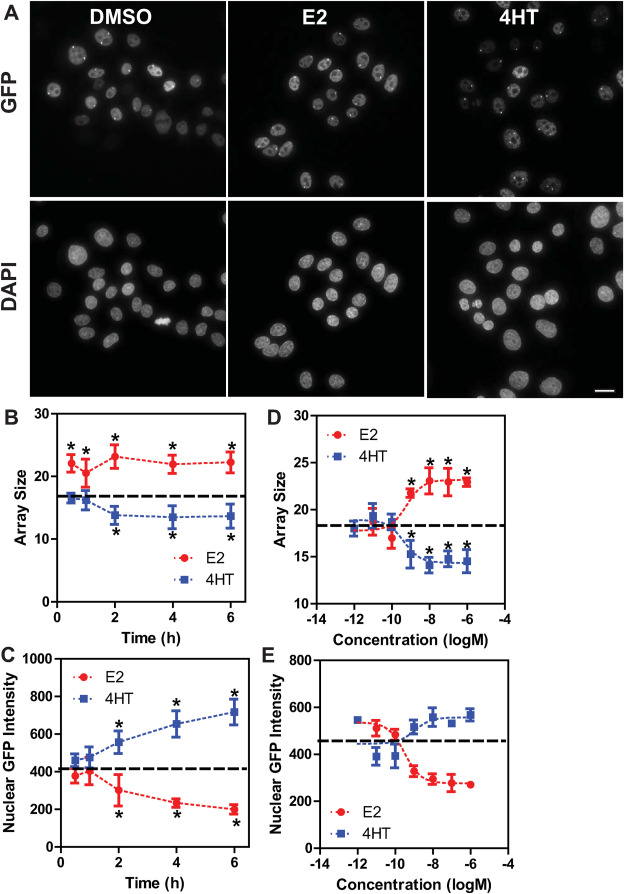
Fig. 1 Characterization of GFP-ERβ:HeLa array cells A) Representative images of GFP-ERβ:PRL-HeLa cells taken following 2-h of the indicated treatments (DMSO, E2 100 nM, 4HT 100 nM). Images are maximum intensity projections acquired at 60x/1.42 and deconvolved. Scale bar:10 μm. B–C) array size (pixels, B) and nuclear GFP intensity (C) metrics after time course analysis of GFP-ERβ:PRL-HeLa cells treated with E2 (10 nM) and 4HT (100 nM). D-E) six-point dose response analysis at the 2-h time-point with E2 and 4HT (1pM to 1 μM) measuring array size (D) and nuclear GFP-ERβ levels (E). In panels B–E the dashed line represents the DMSO control. *p < 0.05 as compared to DMSO control. Error bars are from eight technical replicates.