
|
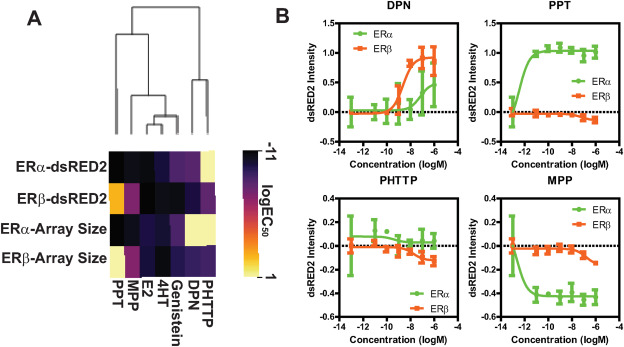
Fig. 3 Comparison of ERα/ERβ PRL-HeLa biosensor models shows model sensitivity in differentiating ER selective compounds (A) Heatmap showing logEC50 values for GFP-ERβ:PRL-HeLa and GFP-ERα:PRL-HeLa cells treated with the indicated chemicals (10pM to 1 μM) for 2-h as measured by transcriptional reporter and chromatin remodeling features; (B) Transcriptional response (dsRED2) of ERα (red) and ERβ (green) PRL-array cells treated with multiple doses of a ERβ selective agonist (DPN), a ERβ selective antagonist (PHTTP), a ERα selective agonist (PPT), or a ERα selective antagonist (MPP). Results are shown as mean and standard deviation from 8 technical replicates. (For interpretation of the references to colour in this figure legend, the reader is referred to the Web version of this article.)