
Image
|
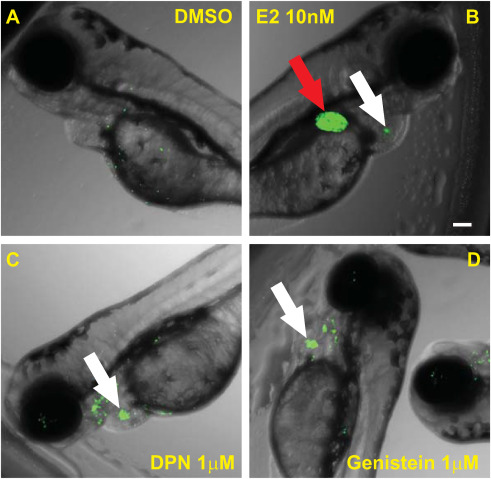
Figure Caption
Fig. 6 Transgenic ERE:GFP reporter zebrafish as an in vivo orthogonal assay to define ERα vs. ERβ activities Representative images of the ERE:GFP Zebrafish at 3dfp treated with: (A) DMSO; (B); 10 nM E2; (C) 1 μM DPN; and, D) 1 μM genistein. Red arrows highlight GFP signal in the liver while white arrows indicate the heart valve. Whole-well images were captured at 4x/0.16. Scale bar is 100 μm. A minimum of ten Zebrafish per treatment were assayed. (For interpretation of the references to colour in this figure legend, the reader is referred to the Web version of this article.)
Acknowledgments
This image is the copyrighted work of the attributed author or publisher, and
ZFIN has permission only to display this image to its users.
Additional permissions should be obtained from the applicable author or publisher of the image.
Full text @ Heliyon