
Image
|
Figure Caption
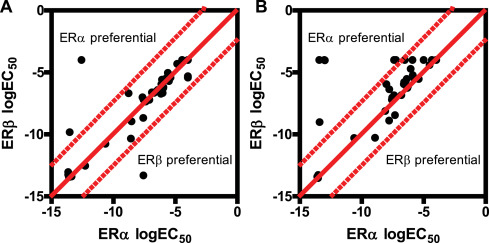
Fig. 5 Comparison of ERs using PRL-HeLa models identifies ERβ interacting compounds in the EPA45 library of control chemicals Scatter plots comparing logEC50 values for the array size (A) or the dsRED2 transcriptional output (B) metrics in ERα and ERβ-containing cells treated for 2-h with a six-point dose-response of the EPA45 chemical library.
Acknowledgments
This image is the copyrighted work of the attributed author or publisher, and
ZFIN has permission only to display this image to its users.
Additional permissions should be obtained from the applicable author or publisher of the image.
Full text @ Heliyon