
|
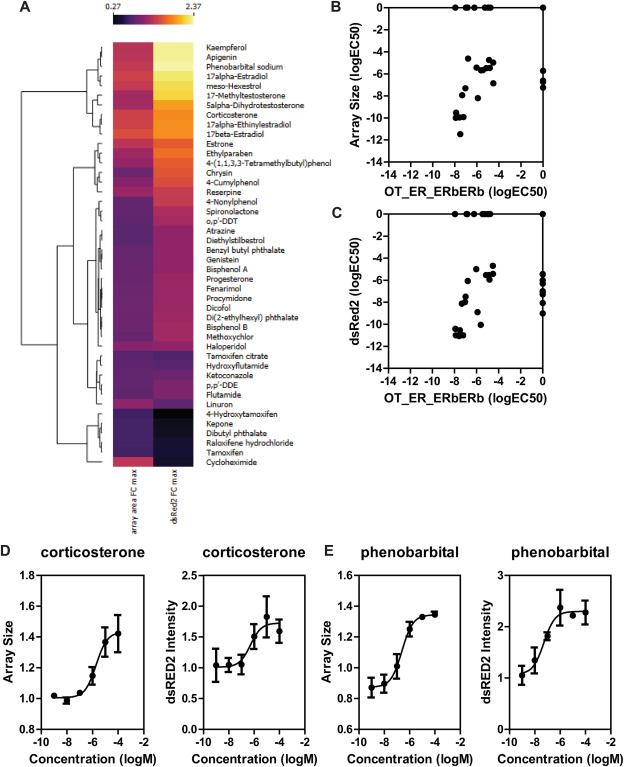
Fig. 4 EPA45 Compound library comparison to ToxCast ERβ dimerization data A) Heatmap showing the effect of EPA45 chemicals on the GFP-ERβ:PRL-HeLa cell line represented as maximal fold change over DMSO control. Data is shown as average of three independent screens. B–C) Comparison of determined logEC50 values of GFP-ERβ:PRL-HeLa array size (B) and dsRED2 intensity (C) vs. Odyssey Thera BiFC ERβ-ERβ dimerization assay. D-E) dose-response analysis for corticosterone (D) and phenobarbital (E) using the array size and dsRed2 intensity metrics. Data is average ± standard deviation of three independent experiments.