FIGURE SUMMARY
Title

TMEM55B links autophagy flux, lysosomal repair, and TFE3 activation in response to oxidative stress

Authors
Jeong, E., Willett, R., Rissone, A., La Spina, M., Puertollano, R.
Source
Full text @ Nat. Commun.

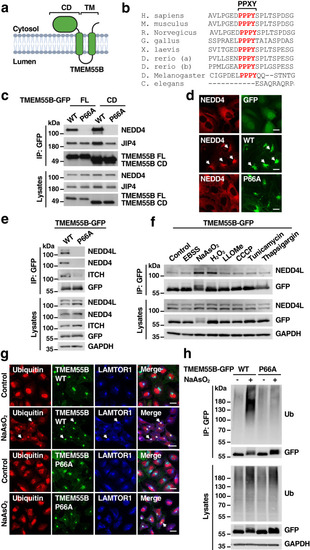
TMEM55B interacts with members of the NEDD4-like family of E3 ligases.

a Schematic of the predicted TMEM55B membrane topology. Illustration created with BioRender.com. b Multi-sequence alignment of TMEM55B orthologs in different species. The PPXY motif is indicated in red. c U2OS cells were transfected with plasmids encoding TMEM55B-GFP-WT full length (FL), TMEM55B-GFP-WT cytosolic domain (CD), TMEM55B-GFP-P66A FL, or P66A CD. Cells were lysed and pulled down with GFP beads. The results are representative of three independent experiments. WT (Wild-type), P66A (P66A mutant). d U2OS TMEM55B KO cells stably expressing mCherry-NEDD4 (red) were transfected with plasmids encoding GFP, TMEM55B-GFP-WT or P66A (green). Cells were fixed and permeabilized for immunofluorescence. Scale bars, 20 μm, n = 3. e U2OS cells were infected with adenovirus expressing TMEM55B-GFP-WT or P66A and pulled down with GFP beads. The results are representative of three independent experiments. f U2OS cells infected with adenovirus expressing TMEM55B-GFP-WT were treated with various drugs and pulled down with GFP beads. EBSS for 4 h, NaAsO2 (300 μM) for 2 h, H2O2 (500 μM) for 4 h, LLOMe (1 mM) for 2 h, CCCP (25 μM) for 4 h, Tunicamycin (10 μg/ml) for 4 h, Thapsigargin (10 μM) for 4 h. The results are representative of three independent experiments. g U2OS cells infected with adenovirus expressing TMEM55B-GFP-WT or P66A (green) were treated with or without NaAsO2 (300 μM) for 2 h. Cells were fixed and immunostained with antibodies against ubiquitin (red) and LAMTOR1 (blue). Scale bars, 20 μm, n = 3. h U2OS cells were transfected with plasmids encoding TMEM55B-GFP-WT or P66A and treated with or without NaAsO2 (300 μM) for 2 h. Cells were lysed and immunoprecipitated with GFP beads under denaturing condition. The results are representative of three independent experiments. Source data are provided as a Source Data file.

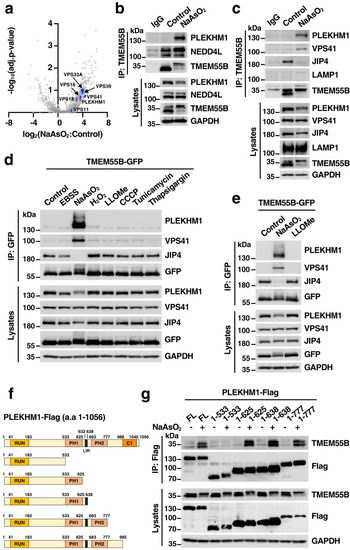
PLEKHM1 interacts with TMEM55B upon NaAsO2 treatment.

a Volcano plot of hits identified in immunoprecipitation and mass spectrometry analysis from U2OS cells infected with adenovirus expressing TMEM55B-GFP-WT treated with NaAsO2 (300 μM), compared to untreated cells. The data were analyzed with two-tailed t test. b, c U2OS cells were treated with or without NaAsO2 (300 μM) for 2 h and immunoprecipitated with anti-TMEM55B antibody. The results are representative of three independent experiments. d U2OS cells infected with adenovirus expressing TMEM55B-GFP-WT were treated with various drugs and pulled down with GFP beads. EBSS for 4 h, NaAsO2 (300 μM) for 2 h, H2O2 (500 μM) for 4 h, LLOMe (1 mM) for 2 h, CCCP (25 μM) for 4 h, Tunicamycin (10 μg/ml) for 4 h, Thapsigargin (10 μM) for 4 h. The results are representative of three independent experiments. e Hela cells infected with adenovirus expressing TMEM55B-GFP were treated with NaAsO2 (300 μM) or LLOMe (1 mM) for 2 h and pulled down with GFP beads. The results are representative of three independent experiments. f Schematic representation of the PLEKHM1 and truncated mutants. g U2OS cells were transfected with Flag-tagged PLEKHM1 plasmid variants and treated with or without NaAsO2 (300 μM) for 2 h. Cells were lysed and immunoprecipitated with Flag beads. The results are representative of two independent experiments. Source data are provided as a Source Data file.

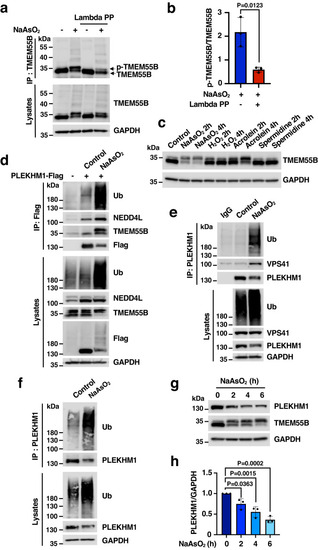
NaAsO2 induces TMEM55B phosphorylation and PLEKHM1 ubiquitination.

a U2OS cells were treated with or without NaAsO2 (300 μM) for 2 h. Cell lysates and samples immunoprecipitated with anti-TMEM55B antibody were incubated with or without Lambda phosphatase. The results are representative of three independent experiments. b Quantification of immunoblots shown in (a). The data represent means ± SEM, n = 3 independent experiments. Statistical significance was determined by using two-tailed unpaired t test. c U2OS cells were treated with NaAsO2 (300 μM), H2O2 (500 μM), Acrolein (200 μM) or Spermidine (300 μM) as indicated times. The results are representative of two independent experiments. d U2OS cells transfected with plasmids encoding PLEKHM1-Flag were treated with or without NaAsO2 (300 μM) for 2 h and immunoprecipitated with Flag beads. The results are representative of three independent experiments. e U2OS cells were treated with or without NaAsO2 (300 μM) for 2 h and immunoprecipitated with anti-PLEKHM1 antibody. The results are representative of two independent experiments. f U2OS cells were treated with NaAsO2 (300 μM) for 2 h and immunoprecipitated with anti-PLEKHM1 antibody under denaturing conditions. The results are representative of three independent experiments. g U2OS cells were treated with NaAsO2 (300 μM) for indicated times and analyzes by immunoblot with the indicated antibodies. The results are representative of three independent experiments. h Quantification of immunoblots shown in (g). The data represent means ± SEM, n = 3 independent experiments. Statistical significance was determined by using one-way ANOVA with Dunnett’s multiple comparisons. Source data are provided as a Source Data file.

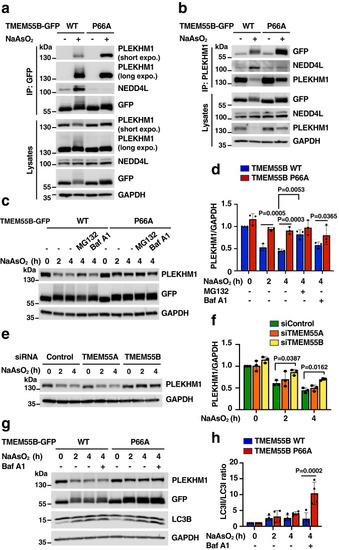
TMEM55B-mediated PLEKHM1 degradation decreases autophagy flux.

a U2OS cells infected with adenovirus expressing TMEM55B-GFP-WT or P66A were treated with or without NaAsO2 (300 μM) for 2 h. Cells were lysed and pulled down with GFP beads. The results are representative of four independent experiments. Short expo. (Shorter exposure), long expo. (Longer exposure). b U2OS cells infected with adenovirus expressing TMEM55B-GFP-WT or P66A were treated with or without NaAsO2 (300 μM) for 2 h. Cells were lysed and immunoprecipitated with anti-PLEKHM1 antibody. The results are representative of three independent experiments. c U2OS cells infected with adenovirus expressing TMEM55B-GFP-WT or P66A were incubated with NaAsO2 (300 μM) in the presence of MG132 (50 μM) or Bafilomycin A1 (100 nM) for the indicated times. The results are representative of three independent experiments. d Quantification of immunoblots shown in (c). The data represent means ± SEM, n = 3 independent experiments. Statistical significance was determined by using two-way ANOVA with Sidak’s multiple comparisons. e siRNA transfected U2OS cells were treated with NaAsO2 (300 μM) for indicated times. The results are representative of three independent experiments. f Quantification of immunoblots shown in (e). The data represent means ± SEM, n = 3 independent experiments. Statistical significance was determined by using two-way ANOVA with Sidak’s multiple comparisons. g U2OS cells infected with adenovirus expressing TMEM55B-GFP-WT or P66A were incubated with NaAsO2 (300 μM) alone or NaAsO2 (300 μM) plus Bafilomycin A1 (200 nM) for indicated times. The results are representative of four independent experiments. h Quantification of immunoblots shown in (g). The data represent means ± SEM, n = 3 independent experiments. Statistical significance was determined by using two-way ANOVA with Sidak’s multiple comparisons. Source data are provided as a Source Data file.

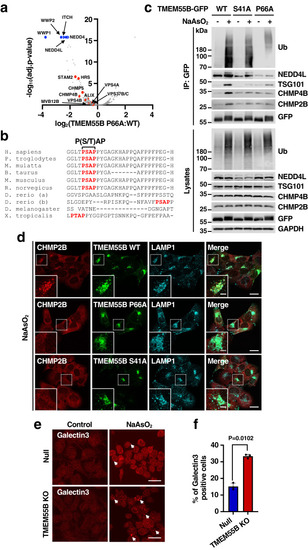
TMEM55B facilitates lysosomal repair by recruiting the ESCRT complex.

a Volcano plot of hits identified by immunoprecipitation and mass spectrometry analysis of U2OS cells infected with adenovirus expressing TMEM55B-GFP-P66A compared to cells infected with adenovirus expressing TMEM55B-GFP-WT under NaAsO2 (300 μM) treatment. The data were analyzed with two-tailed t test. b Multi-sequence alignment of TMEM55B orthologs in different species. The P(S/T)AP motif is marked in red. c U2OS cells transfected with plasmid encoding TMEM55B-GFP-WT, S41A or P66A were treated with or without NaAsO2 (300 μM) for 2 h. Cells were lysed and pulled down with GFP beads. The results are representative of three independent experiments. d U2OS TMEM55B KO cells transfected with plasmid encoding TMEM55B-GFP WT, S41A, P66A (green) were treated with NaAsO2 (300 μM) for 2 h. Cells were fixed and immunostained with antibodies against CHMP2B (red) and LAMP1 (blue). Scale bars, 20 μm. Inset scale bars, 10 μm. n = 3. e Null and TMEM55B KO HeLa cells were treated with or without NaAsO2 (300 μM) for 6 h. Cells were fixed and immunostained with anti-Galectin3 antibody. Scale bars, 20 μm. f Quantification of immunofluorescence images shown in (e). The data represent means ± SEM. n = 200 cells examined over 3 independent experiments. Statistical significance was determined by using two-tailed unpaired t test. Source data are provided as a Source Data file.

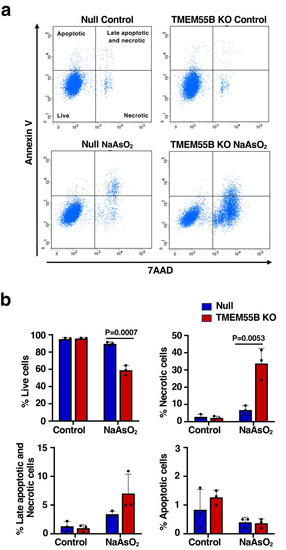
Depletion of TMEM55B reduces cell viability under oxidative stress conditions.

a Null and TMEM55B KO U2OS cells were treated with or without NaAsO2 (300 μM) for 10 h. Cells were analyzed by Flow cytometry with Annexin V and 7AAD. 7AAD+ are necrotic, Annexin V+ are apoptotic and Annexin V + /7AAD+ are late apoptotic and necrotic cells. b Quantification of the population of live, necrotic (7AAD + ), apoptotic cells (Annexin V + ) and late apoptotic and necrotic cells (Annexin + /7AAD + ) from (a). The data represent means ± SEM, n = 3 independent experiments. Data taken from three independent experiments and statistical significance was determined by using two-way ANOVA with Sidak’s multiple comparisons. Source data are provided as a Source Data file.

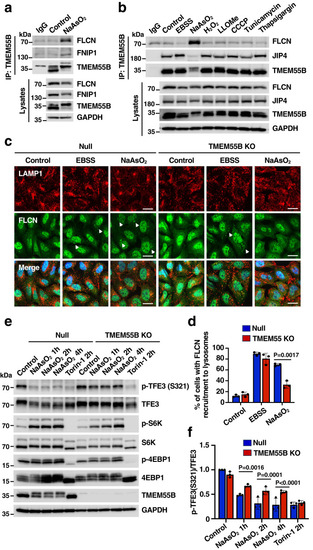
TMEM55B promotes TFE3 activation through FLCN sequestration.

a U2OS cells treated with or without NaAsO2 (300 μM) for 2 h were lysed and immunoprecipitated with anti-TMEM55B antibody. The results are representative of three independent experiments. b U2OS cells treated with various drugs were lysed and immunoprecipitated with anti-TMEM55B antibody. EBSS for 4 h, NaAsO2 (300 μM) for 2 h, H2O2 (500 μM) for 4 h, LLOMe (1 mM) for 2 h, CCCP (25 μM) for 4 h, Tunicamycin (10 μg/ml) for 4 h, Thapsigargin (10 μM) for 4 h. The results are representative of three independent experiments. c Null and TMEM55B KO U2OS cells were treated with either EBSS for 4 h or NaAsO2 (300 μM) for 2 h. Cells were fixed and immunostained with antibodies against LAMP1 (red) and FLCN (green). Scale bars, 20 μm. n = 3. d Quantification of immunofluorescence images shown in (c). The data represent means ± SEM, n = 200 cells examined over 3 independent experiments. e Null and TMEM55B KO U2OS cells were treated with either NaAsO2 (300 μM) or Torin-1 (250 nM) for the indicated times. Samples were analyzed by immunoblot with the indicated antibodies. The results are representative of three independent experiments. f Quantification of immunoblots shown in (e). The data represent means ± SEM, n = 3 independent experiments. Statistical significance was determined by using two-way ANOVA with Sidak’s multiple comparisons. Source data are provided as a Source Data file.

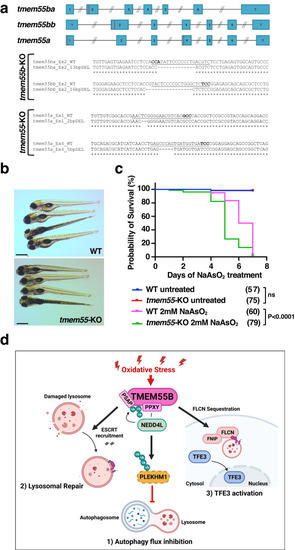
Generation and characterization of tmem55-KO mutants.

a (Top panel) Schematic representation of zebrafish tmem55ba, tmem55bb and tmem55a genes with exons shown as blue rectangles connected by introns. Red bars show the target region of the sgRNAs used for CRISPR/Cas9 knockout. Neither exons nor introns are drawn to scale. (Bottom panel) Nucleotide sequences of CRISPR target regions in exons 2 of tmem55ba and tmem55bb and exons 1 and 4 of tmem55a genes. sgRNAs are underlined, PAM sites are in bold and deleted nucleotides in the mutant alleles are marked by dashes. b Representative pictures of WT and tmem55-KO at 5 dpf. All embryos are depicted with anterior to the left. Scale bars = 500 μm. c Kaplan-Meier curves showing the survival rates in zebrafish embryos following continuous exposure to 2 mM NaAsO2 from 1 dpf stage. Untreated embryos are used as controls. The number of embryos per group is indicated in parenthesis. (Logrank test, P < 0.0001). Data in (b) and (c) show one representative experiment out of three independently performed. d Model depicting the proposed role of TMEM55B orchestrating cellular responses to oxidative stress. Illustration created with BioRender.com. Source data are provided as a Source Data file.

Acknowledgments
This image is the copyrighted work of the attributed author or publisher, and ZFIN has permission only to display this image to its users. Additional permissions should be obtained from the applicable author or publisher of the image. Full text @ Nat. Commun.