|
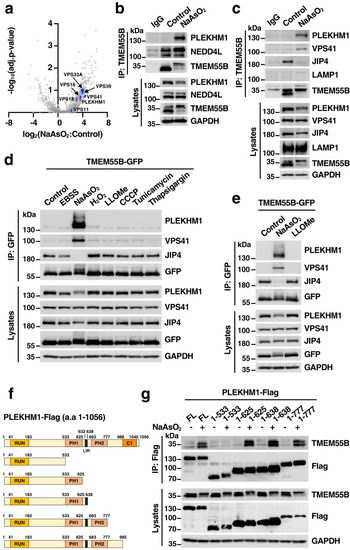
PLEKHM1 interacts with TMEM55B upon NaAsO2 treatment. a Volcano plot of hits identified in immunoprecipitation and mass spectrometry analysis from U2OS cells infected with adenovirus expressing TMEM55B-GFP-WT treated with NaAsO2 (300 μM), compared to untreated cells. The data were analyzed with two-tailed t test. b, c U2OS cells were treated with or without NaAsO2 (300 μM) for 2 h and immunoprecipitated with anti-TMEM55B antibody. The results are representative of three independent experiments. d U2OS cells infected with adenovirus expressing TMEM55B-GFP-WT were treated with various drugs and pulled down with GFP beads. EBSS for 4 h, NaAsO2 (300 μM) for 2 h, H2O2 (500 μM) for 4 h, LLOMe (1 mM) for 2 h, CCCP (25 μM) for 4 h, Tunicamycin (10 μg/ml) for 4 h, Thapsigargin (10 μM) for 4 h. The results are representative of three independent experiments. e Hela cells infected with adenovirus expressing TMEM55B-GFP were treated with NaAsO2 (300 μM) or LLOMe (1 mM) for 2 h and pulled down with GFP beads. The results are representative of three independent experiments. f Schematic representation of the PLEKHM1 and truncated mutants. g U2OS cells were transfected with Flag-tagged PLEKHM1 plasmid variants and treated with or without NaAsO2 (300 μM) for 2 h. Cells were lysed and immunoprecipitated with Flag beads. The results are representative of two independent experiments. Source data are provided as a Source Data file.
|