|
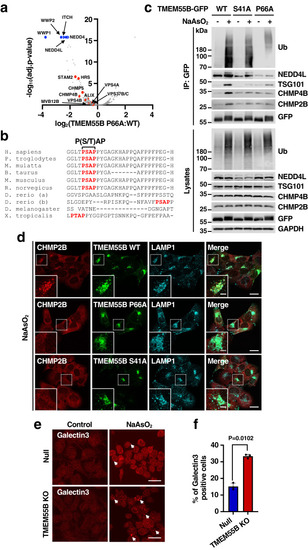
TMEM55B facilitates lysosomal repair by recruiting the ESCRT complex. a Volcano plot of hits identified by immunoprecipitation and mass spectrometry analysis of U2OS cells infected with adenovirus expressing TMEM55B-GFP-P66A compared to cells infected with adenovirus expressing TMEM55B-GFP-WT under NaAsO2 (300 μM) treatment. The data were analyzed with two-tailed t test. b Multi-sequence alignment of TMEM55B orthologs in different species. The P(S/T)AP motif is marked in red. c U2OS cells transfected with plasmid encoding TMEM55B-GFP-WT, S41A or P66A were treated with or without NaAsO2 (300 μM) for 2 h. Cells were lysed and pulled down with GFP beads. The results are representative of three independent experiments. d U2OS TMEM55B KO cells transfected with plasmid encoding TMEM55B-GFP WT, S41A, P66A (green) were treated with NaAsO2 (300 μM) for 2 h. Cells were fixed and immunostained with antibodies against CHMP2B (red) and LAMP1 (blue). Scale bars, 20 μm. Inset scale bars, 10 μm. n = 3. e Null and TMEM55B KO HeLa cells were treated with or without NaAsO2 (300 μM) for 6 h. Cells were fixed and immunostained with anti-Galectin3 antibody. Scale bars, 20 μm. f Quantification of immunofluorescence images shown in (e). The data represent means ± SEM. n = 200 cells examined over 3 independent experiments. Statistical significance was determined by using two-tailed unpaired t test. Source data are provided as a Source Data file.
|