IMAGE

Fig. 2

ID
ZDB-IMAGE-240105-37
Source
Figures for Jeong et al., 2024
Image
Figure Caption

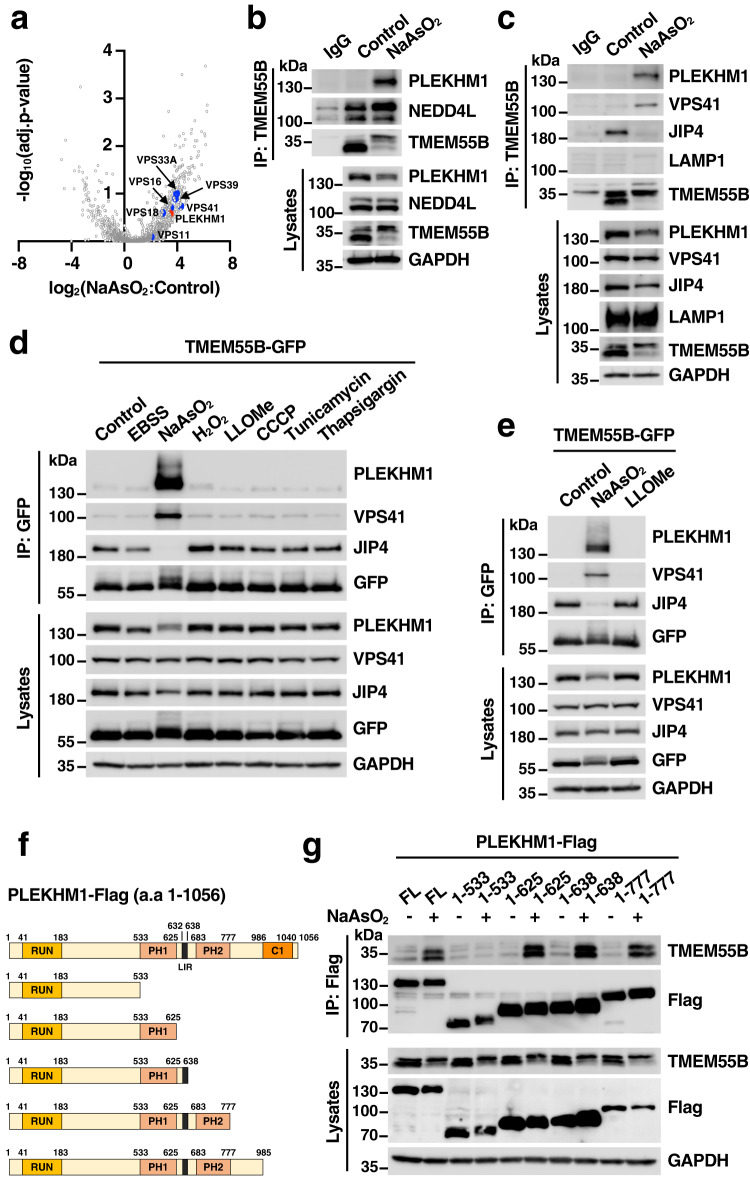
Fig. 2 PLEKHM1 interacts with TMEM55B upon NaAsO2 treatment.

a Volcano plot of hits identified in immunoprecipitation and mass spectrometry analysis from U2OS cells infected with adenovirus expressing TMEM55B-GFP-WT treated with NaAsO2 (300 μM), compared to untreated cells. The data were analyzed with two-tailed t test. b, c U2OS cells were treated with or without NaAsO2 (300 μM) for 2 h and immunoprecipitated with anti-TMEM55B antibody. The results are representative of three independent experiments. d U2OS cells infected with adenovirus expressing TMEM55B-GFP-WT were treated with various drugs and pulled down with GFP beads. EBSS for 4 h, NaAsO2 (300 μM) for 2 h, H2O2 (500 μM) for 4 h, LLOMe (1 mM) for 2 h, CCCP (25 μM) for 4 h, Tunicamycin (10 μg/ml) for 4 h, Thapsigargin (10 μM) for 4 h. The results are representative of three independent experiments. e Hela cells infected with adenovirus expressing TMEM55B-GFP were treated with NaAsO2 (300 μM) or LLOMe (1 mM) for 2 h and pulled down with GFP beads. The results are representative of three independent experiments. f Schematic representation of the PLEKHM1 and truncated mutants. g U2OS cells were transfected with Flag-tagged PLEKHM1 plasmid variants and treated with or without NaAsO2 (300 μM) for 2 h. Cells were lysed and immunoprecipitated with Flag beads. The results are representative of two independent experiments. Source data are provided as a Source Data file.

Acknowledgments
This image is the copyrighted work of the attributed author or publisher, and ZFIN has permission only to display this image to its users. Additional permissions should be obtained from the applicable author or publisher of the image. Full text @ Nat. Commun.