IMAGE

Fig. 7

ID
ZDB-IMAGE-240105-42
Source
Figures for Jeong et al., 2024
Image
Figure Caption

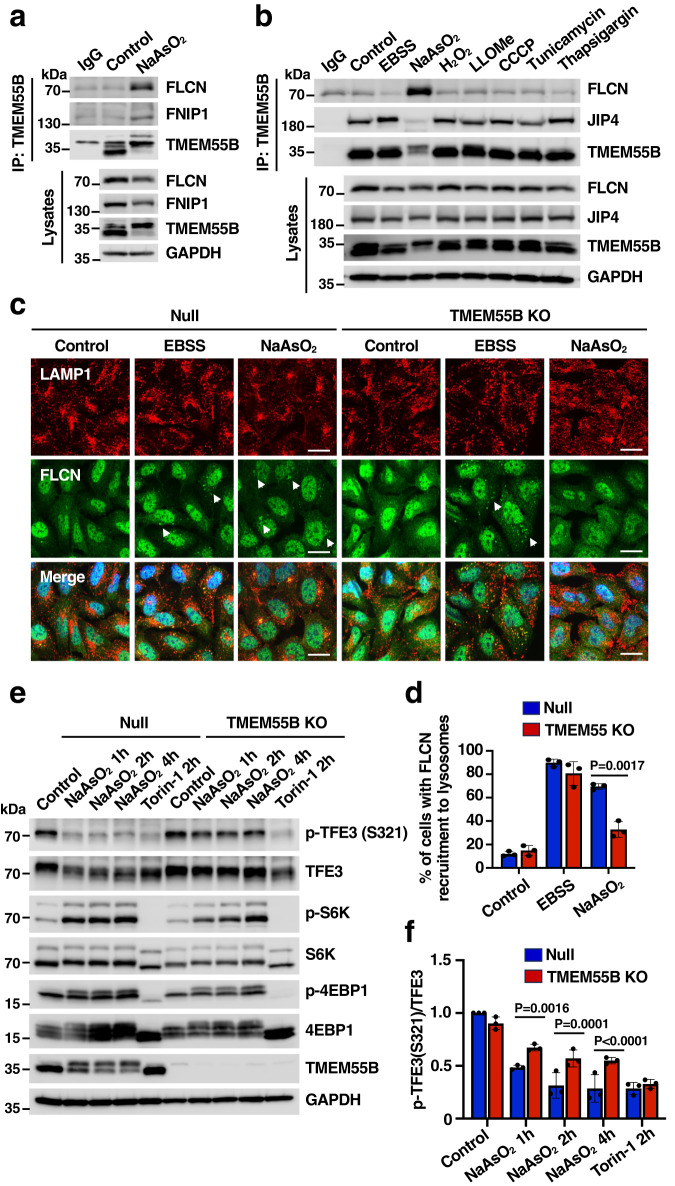
Fig. 7 TMEM55B promotes TFE3 activation through FLCN sequestration.

a U2OS cells treated with or without NaAsO2 (300 μM) for 2 h were lysed and immunoprecipitated with anti-TMEM55B antibody. The results are representative of three independent experiments. b U2OS cells treated with various drugs were lysed and immunoprecipitated with anti-TMEM55B antibody. EBSS for 4 h, NaAsO2 (300 μM) for 2 h, H2O2 (500 μM) for 4 h, LLOMe (1 mM) for 2 h, CCCP (25 μM) for 4 h, Tunicamycin (10 μg/ml) for 4 h, Thapsigargin (10 μM) for 4 h. The results are representative of three independent experiments. c Null and TMEM55B KO U2OS cells were treated with either EBSS for 4 h or NaAsO2 (300 μM) for 2 h. Cells were fixed and immunostained with antibodies against LAMP1 (red) and FLCN (green). Scale bars, 20 μm. n = 3. d Quantification of immunofluorescence images shown in (c). The data represent means ± SEM, n = 200 cells examined over 3 independent experiments. e Null and TMEM55B KO U2OS cells were treated with either NaAsO2 (300 μM) or Torin-1 (250 nM) for the indicated times. Samples were analyzed by immunoblot with the indicated antibodies. The results are representative of three independent experiments. f Quantification of immunoblots shown in (e). The data represent means ± SEM, n = 3 independent experiments. Statistical significance was determined by using two-way ANOVA with Sidak’s multiple comparisons. Source data are provided as a Source Data file.

Acknowledgments
This image is the copyrighted work of the attributed author or publisher, and ZFIN has permission only to display this image to its users. Additional permissions should be obtained from the applicable author or publisher of the image. Full text @ Nat. Commun.