IMAGE

Fig. 8

ID
ZDB-IMAGE-240105-43
Source
Figures for Jeong et al., 2024
Image
Figure Caption

Fig. 8 
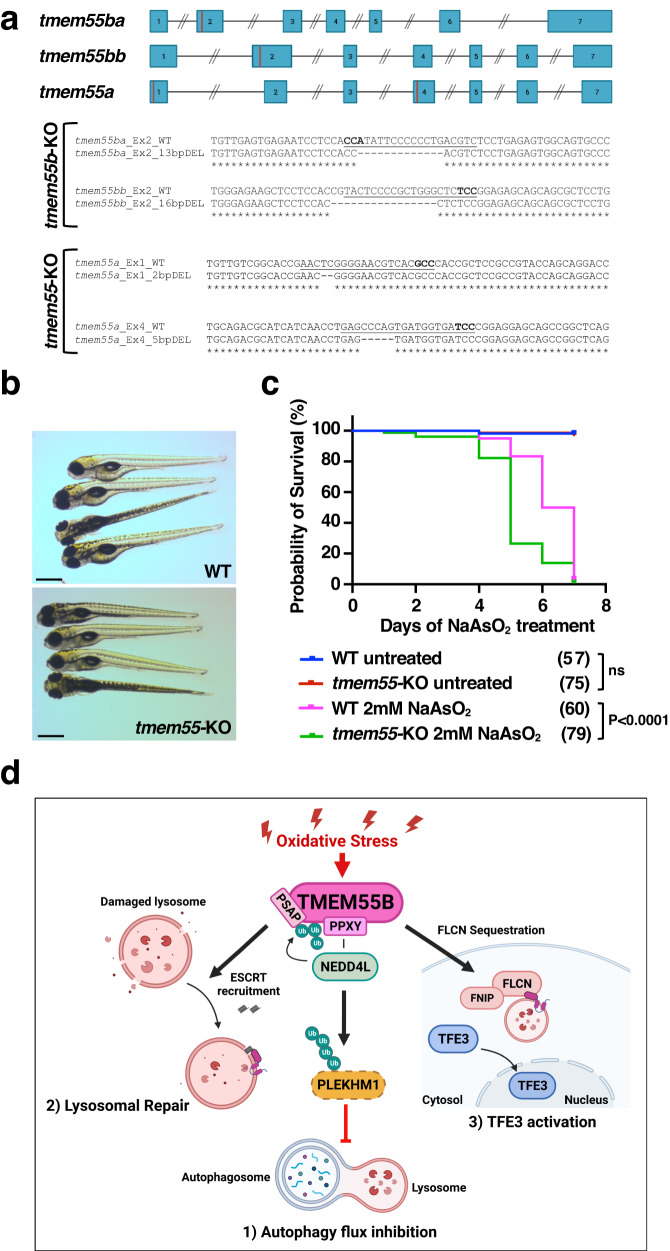
Generation and characterization of tmem55-KO mutants.

a (Top panel) Schematic representation of zebrafish tmem55ba, tmem55bb and tmem55a genes with exons shown as blue rectangles connected by introns. Red bars show the target region of the sgRNAs used for CRISPR/Cas9 knockout. Neither exons nor introns are drawn to scale. (Bottom panel) Nucleotide sequences of CRISPR target regions in exons 2 of tmem55ba and tmem55bb and exons 1 and 4 of tmem55a genes. sgRNAs are underlined, PAM sites are in bold and deleted nucleotides in the mutant alleles are marked by dashes. b Representative pictures of WT and tmem55-KO at 5 dpf. All embryos are depicted with anterior to the left. Scale bars = 500 μm. c Kaplan-Meier curves showing the survival rates in zebrafish embryos following continuous exposure to 2 mM NaAsO2 from 1 dpf stage. Untreated embryos are used as controls. The number of embryos per group is indicated in parenthesis. (Logrank test, P < 0.0001). Data in (b) and (c) show one representative experiment out of three independently performed. d Model depicting the proposed role of TMEM55B orchestrating cellular responses to oxidative stress. Illustration created with BioRender.com. Source data are provided as a Source Data file.

Acknowledgments
This image is the copyrighted work of the attributed author or publisher, and ZFIN has permission only to display this image to its users. Additional permissions should be obtained from the applicable author or publisher of the image. Full text @ Nat. Commun.