FIGURE SUMMARY
Title

Common and divergent gene regulatory networks control injury-induced and developmental neurogenesis in zebrafish retina

Authors
Lyu, P., Iribarne, M., Serjanov, D., Zhai, Y., Hoang, T., Campbell, L.J., Boyd, P., Palazzo, I., Nagashima, M., Silva, N.J., Hitchcock, P.F., Qian, J., Hyde, D.R., Blackshaw, S.
Source
Full text @ Nat. Commun.

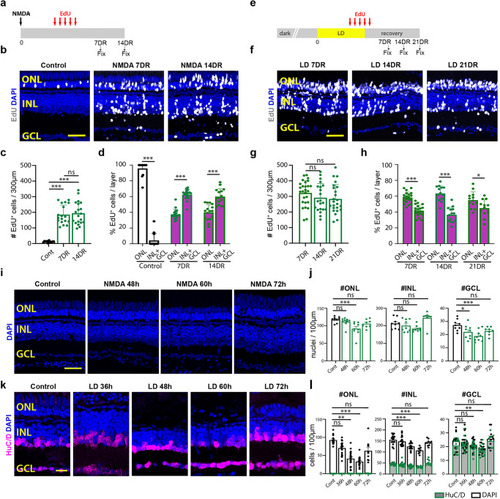
Comparison of NMDA-induced and light-induced retinal damage.

a Schematic of NMDA-induced damage experiment. b EdU-labeling in control retinas and following NMDA damage. c Quantification of the number of EdU-labeled cells in all three retinal layers. Control (Cont) n = 13, 7 days recovery (DR) n = 18, 14DR n = 20. Three independent experiments. d The percentage of EdU-labeled cells in the Outer Nuclear Layer (ONL) vs. combined in the Inner Nuclear Layer (INL) and Ganglion Cell Layer (GCL). Cont ONL and INL + GCL n = 13; 7DR ONL and INL + GCL n = 18, 14DR ONL and INL + GCL n = 20. Three independent experiments. e Schematic of light-induced damage (LD) experiment. f EdU-labeling following light damage (LD). g Quantification of the number of EdU-labeled cells in all three retinal layers. 7DR n = 27, 14DR n = 21, 21DR n = 24. Three independent experiments. h The percentage of the EdU-labeled cells in the ONL vs. combined in the INL + GCL. 7DR ONL and INL + GCL n = 27; 14DR ONL and INL + GCL n = 24; 21DR ONL and INL + GCL n = 24. Three independent experiments. i DAPI staining of undamaged retinas and 48, 60, and 72 h after injecting NMDA. j Quantification of the number of DAPI-labeled nuclei in the ONL, INL, and GCL. Cont, 48 h, and 60 h (ONL, INL, GCL) n = 9; 72 h (ONL, INL, GCL) n = 8. k DAPI and HuC/D staining of undamaged retinas and 36, 48, 60, and 72 h after starting constant light treatment. l Quantification of the number of DAPI- or HuC/D-labeled nuclei in the ONL, INL, and GCL. Cont (ONL, INL, GCL) n = 15; 36 h (ONL, INL, GCL) n = 20; 48 h (ONL, INL, GCL) n = 17; 60 h (ONL, INL, GCL) n = 16; 72 h (ONL, INL, GCL) n = 10. Scale bars in (b, f, i) are 20 μm and in (k) is 14 μm. ch, j, l Data are presented as mean values ± SEM. For statistical analysis, one-way ANOVA was followed by t-test with Dunnett’s method for multiple comparisons correction. Asterisks indicate statistically significant differences between the indicated groups (*p ≤ 0.05, **p ≤ 0.01, ***p ≤ 0.001). Source data are provided as a Source Data file 1.

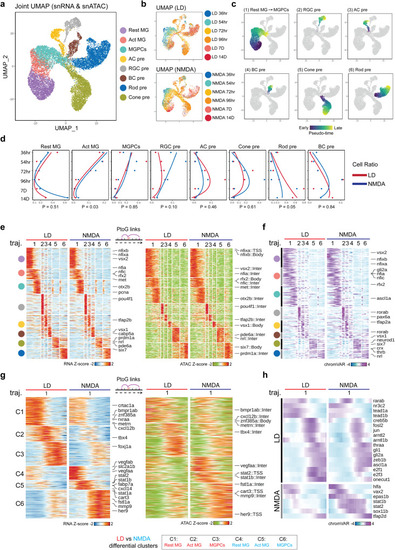
Shared and differential patterns of gene expression and chromatin accessibility data observed in MG-derived cells following LD and NMDA treatment.

a, b Combined UMAP projection of Müller glia (MG) and progenitor neuron cells profiled using multiomic sequencing. Each point (cell) is colored by cell type (a) and time points (b). Resting (Rest); Activated (Act); MG-derived progenitor cells (MGPCs); amacrine cell (AC); retinal ganglion cell (RGC); bipolar cell (BC); precursor (pre). c UMAPs showing trajectories constructed from mutiomics datasets of combined light damage (LD) and NMDA datasets. Color indicates pseudotime state. d Line graphs showing the fraction of cells (x axis) at each time point (y axis) of each cell type. Lines are colored by treatment. The paired t-test were used to compare the cell fraction from LD and NMDA. p values are labeled at the bottom of the graph. e Heatmap shows the consensus marker genes and their related marker peaks (TSS and enhancer) between LD and NMDA treatment for each cell type. f Heatmap shows the consensus motifs between LD and NMDA treatment for each cell type. g Heatmap shows the differential genes and their related differential peaks (TSS and enhancer) between LD and NMDA treatment for MG (Rest), MG (Act) and MGPCs. h Heatmap shows the differential motifs between LD and NMDA treatment for MG (Rest), MG(Act), and MGPCs.

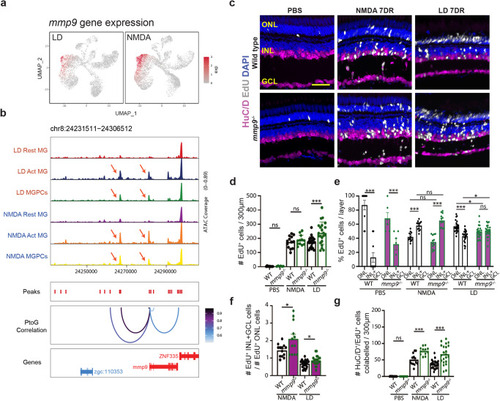
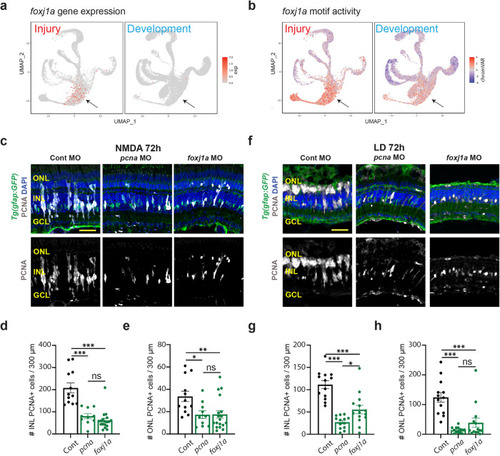
Mmp9 selectively inhibits generation of inner retinal neurons from MGPCs.

a UMAP plot showing expression pattern of mmp9 in LD (light damage) and NMDA-treated retina. b Altered chromatin accessibility in putative regulatory sequences associated with mmp9 following both LD and NMDA damage. c PBS-injected control, NMDA-treated, and LD retinas at 7 days recovery (DR) immunostained with HuC/D to label retinal ganglion cells and amacrine cells, EdU, and counterstained with DAPI. Outer nuclear layer (ONL); inner nuclear layer (INL); ganglion cell layer (GCL). d Quantification of the number of EdU-labeled cells in all three retinal layers in wild-type (WT) and mmp9 mutants following either PBS injection, NMDA damage, or LD. (PBS) WT n = 10, mmp9−/−n = 6; (NMDA) WT n = 13, mmp9−/−n = 12; (LD) WT n = 23, mmp9−/−n = 22. Three replicate experiments. e The percentage of EdU-positive cells in the ONL vs. the INL + GCL is plotted for wild-type and mmp9 mutant retinas after PBS injection, NMDA damage, and light damage. (PBS) WT n = 10, mmp9−/−n = 6; (NMDA) WT n = 13, mmp9−/−n = 12; (LD) WT n = 23, mmp9−/−n = 22. Three replicate experiments. f The ratio of EdU-positive ONL cells to EdU-positive INL + GCL cells is plotted for wild-type and mmp9 mutant fish following either NMDA damage or light damage. (NMDA) WT n = 13, mmp9−/−n = 12; (LD) WT n = 23, mmp9−/−n = 22. Three replicate experiments. g Quantification of the number of cells colabelled for EdU and HuC/D in PBS-injected, NMDA-injected, and light-damaged retinas. (PBS) WT n = 10, mmp9−/−n = 6; (NMDA) WT n = 13, mmp9−/−n = 12; (LD) WT n = 23, mmp9−/−n = 22. Three replicate experiments. Magenta bars indicate data from mmp9 mutants. Scale bar in (c) is 20 μm. dg Data are presented as mean values ± SEM. Students’ t test was performed for (d, f, g), while two-way ANOVA with Bonferroni’s post hoc test for (e). Asterisks indicate statistically significant differences between the indicated groups (*p ≤ 0.05, ***p ≤ 0.001). Source data are provided as a Source Data file 1.

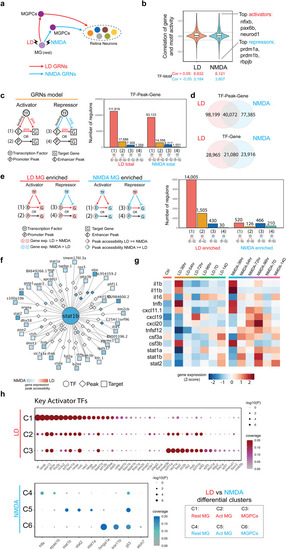
Transcription factors controlling differential gene expression in MG and MGPC following LD and NMDA treatment.

a Schematic of gene regulatory networks (GRNs) that direct Müller glia (MG) reprogramming and MG-derived progenitor cell (MGPC) differentiation after injury via light damage (LD) and NMDA treatment. b Inference of activator and repressor function for each individual transcription factor from multiomic datasets. The y-axis represents the correlation distribution between gene expression and chromVAR score. The top three activator and repressor TF-Motif pairs are shown on the right. The center, lower/upper bound of the boxplot shows the median, 25th and 75th of the correlations, The whiskers extend from the ends of the box to the smallest and largest values that are within 1.5 times the IQR from the lower and upper quartiles, respectively. c Gene regulatory networks of LD and NMDA datasets. (left) Triple regulons model. A circle indicates a TF, a rectangle indicates a target gene, and a diamond indicates a peak. (right) barplot shows the types of regulons between LD and NMDA datasets. d Venn diagram shows the overlap of regulons between LD and NMDA datasets. e Enriched gene regulatory networks of LD and NMDA treatment. (left) Enriched Triple regulons model for each condition. A circle indicates a TF, a rectangle indicates a target gene, and a diamond indicates a peak. Color indicates the log2 fold change of gene/peak between LD and NMDA datasets.(right) barplot shows the number of different types of regulons between LD and NMDA enriched GRNs. f An example of stat2 regulons. A circle indicates a TF, a rectangle indicates a target gene, and a diamond indicates a peak. Color indicates the log2 fold change of gene/peak between LD and NMDA datasets. g Heatmap showing the differentially expressed genes in microglia/macrophages after LD and NMDA treatment. Microglia/macrophage cells are ordered by time points after injury, and an averaged expression level is shown for each time point. Color represents mean-centered normalized expression levels. h Dotplot displays the key activator TFs for each divergent gene cluster. The color represents the ratio of the TF’s targets within that gene cluster, while the dot size indicates the p value of the TF’s regulatory specificity for the respective gene cluster. Hypergeometric test were used test whether the TF’s targets are enriched in the DEG clusters.

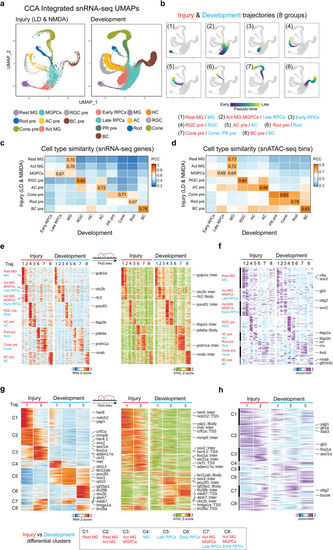
Shared and differential features of MG-derived cells between injury and development datasets

a Integrated UMAP projection of Müller glia (MG) and progenitor neuron cells using injury (light damage (LD) and NMDA; left) and development (right) snRNA-Seq datasets. Each point (cell) is colored by cell type in each dataset. Resting (Rest); Activated (Act); MG-derived progenitor cells (MGPCs); amacrine cell (AC); retinal ganglion cell (RGC); bipolar cell (BC); precursor (pre); retinal progenitor cell (RPC); photoreceptor (PR); horizontal cell (HC). b UMAPs showing the eight trajectories (groups) constructed from the integrated UMAPs of combined injury and development datasets. Color indicates pseudotime state. The label indicates the cell types included for each trajectory. The heatmap displays the Pearson correlations between the cell types from the injury and development datasets using snRNA-Seq RNA expression (c) and snATAC-seq bin signals (d). The highest correlation score for each injury cell type is labeled on the heatmap. e Heatmap shows the consensus marker genes and their related marker peaks (TSS and enhancer) between injury and development model for each group. f Heatmap shows the consensus motifs between injury and development model for each group. g Heatmap shows the differential genes and their related differential peaks (TSS and enhancer) between injury and development model for MG groups (group1 and group2). h Heatmap shows the differential motifs between injury and development model for MG groups (group1 and group2).

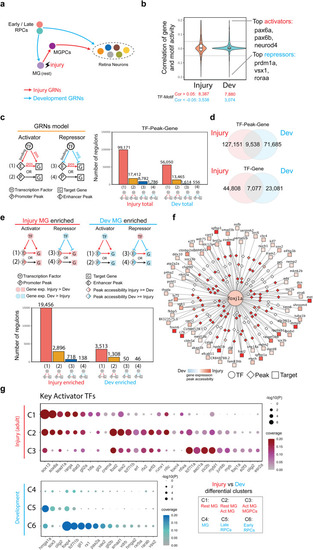
Transcription factors controlling differential expression genes in MGPC in injured retina and progenitor cells in developing retina.

a Schematic of gene regulatory networks (GRNs) that direct retinal progenitor cell (RPC) differentiation during development, Müller glia (MG) reprogramming following injury, and MG-derived progenitor cell (MGPC) differentiation during regeneration. b Inference of activator and repressor function for each individual transcription factor from multiomic datasets. The y-axis represents the correlation distribution between gene expression and chromVAR score. The top three activator and repressor TFs are shown on the right. The center, lower/upper bound of the boxplot shows the median, 25th and 75th of the correlations, The whiskers extend from the ends of the box to the smallest and largest values that are within 1.5 times the IQR from the lower and upper quartiles, respectively. c Gene regulatory networks of injury and development datasets. (left) Triple regulons model, A circle indicates a TF, a rectangle indicates a target gene, and a diamond indicates a peak (right) barplot shows the number of types of regulons. d Venn diagram shows the overlap of regulons between injury and development GRNs. e Enriched gene regulatory networks of injury and development. (Left) Enriched Triple regulons model for each condition. A circle indicates a TF, a rectangle indicates a target gene, and a diamond indicates a peak. Color indicates the log2 fold change of gene/peak between injury and developmental datasets. (Right) barplot shows the number of different types of regulons between injury and development enriched GRNs. f An example of foxj1a regulons. Color indicates the log2 fold change of gene/peak between injury and developmental datasets. A circle indicates a TF, a rectangle indicates a target gene, and a diamond indicates a peak. g Dotplot showing key activator TFs for each divergent gene cluster. The color of the dot showing the gene ratio and the size indicates the p value of the TF’s regulatory specificity of the regulatory relationship. Hypergeometric test were used test whether the TF’s targets are enriched in the DEG clusters.

foxj1a is required for MGPC proliferation.

a UMAPs showing the gene expression pattern of foxj1a between injury (left) and development model (right). b UMAPs showing the chromVAR motif activity of foxj1a between injury (left) and development model (right). c Tg(gfap:GFP) retinas electroporated with either Standard Control morpholino (Cont MO), pcna MO, or foxj1a MO were isolated 72 h after NMDA injection and immunostained for PCNA, GFP, and counterstained with DAPI. Outer nuclear layer (ONL); inner nuclear layer (INL); ganglion cell layer (GCL). d Quantification of the number of PCNA-labeled cells in the INL. Cont n = 12, pcnan = 10, foxj1an = 18. Three independent experiments. e Quantification of the number of PCNA-labeled cells in the ONL. Cont n = 12, pcnan = 10, foxj1an = 18. Three independent experiments. f Tg(gfap:GFP) retinas electroporated with either Cont MO, pcna MO, or foxj1a MO were isolated after 72 h of light damage (LD) and immunostained for PCNA, GFP, and DAPI. g Quantification of the number of PCNA-labeled cells in the INL. Cont and pcnan = 13, foxj1an = 14. Three independent experiments. h Quantification of the number of PCNA-labeled cells in the ONL. Cont and pcnan = 13, foxj1an = 14. Three independent experiments. Scale bars in (c) and (f) are 20 μm. d, e, g, h Data are presented as mean values ± SEM. For statistical analysis, one-way ANOVA was followed by t-test with Dunnett’s method for multiple comparisons correction. Asterisks indicate statistically significant differences between the indicated groups (*p ≤ 0.05, **p ≤ 0.01, ***p ≤ 0.001). Source data are provided as a Source Data file 1.

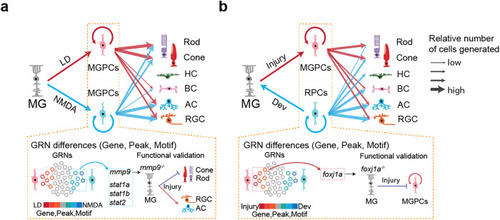
Schematic summary of key findings from this study.

a Summary of major differences between MGPCs induced by light damage and NMDA excitotoxicity. b Summary of major differences between MGPCs and RPCs induced by injury and during development.

Acknowledgments
This image is the copyrighted work of the attributed author or publisher, and ZFIN has permission only to display this image to its users. Additional permissions should be obtained from the applicable author or publisher of the image. Full text @ Nat. Commun.